


GOLD & CRUDE OIL TALKING POINTS:
- Gold prices up as ECB-driven EURUSD rise broadly hurts the Dollar
- Crude oil prices jump on hopes for resolution in US-Mexico trade spat
- Disappointing US payrolls data may not necessarily bode well for gold
Gold prices rose despite a cautious rise in bond yields, which might’ve been expected to weigh on the non-interest-bearing metal. Support came from a weaker US Dollar, which spoke to gold’s anti-fiat appeal. The currency weakened as a rise in the bellwether EURUSD exchange rate courtesy of the ECB policy announcement echoed more broadly to its other crosses.
Crude oil prices leapt higher toward the end of the trading day as Mexican officials hinted at progress in trade talks with the US. This follows President Donald Trump’s threat of imposing tariffs on Mexico’s imports unless and until it ends the flow of illegal immigration across the US’ southern border. Markets have worried that trade tensions will erode energy demand.
WILL GOLD PRICES RISE OR FALL IF US JOBS DATA DISAPPOINTS?
May’s US jobs data is now in focus. A rise of 175k in nonfarm payrolls is expected. That than the prior month’s 263k increase, but not catastrophically so. In fact, with the jobless rate expected to hold at a 50-year low of 3.6 percent while wages continue growing at a healthy pace of 3.2 percent on-year, the smaller jobs gain might be seen to reflect a tighter labor market rather than something negative.
Having said that, US data flow has tended to undershoot baseline forecasts over the past four months, warning that analysts’ models are overstating the economy’s vigor and opening the door for a downside surprise. At face value, such an outcome might boost Fed rate cut bets and send gold higher as yields and the Greenback fall in tandem. Sentiment may even firm as stimulus prospects grow, lifting crude oil.
Markets are already priced for dramatic easing however, with Fed Funds futures implying that one 25bps cut is a foregone conclusion while the probability of 50bps in stimulus stands at a hefty 82.6 percent. Even a 75bps reduction now commands better-than-even odds at 51percent. That might leave relatively little room for a further dovish shift.
That means the markets might well onboard soft US jobs data on pure sentiment grounds, with a risk-off tilt triggered as investors fret about belated spillover of a global economic slowdown ongoing since early 2018. The US Dollar may catch a haven bid in this version of events, weighing on gold. Meanwhile, crude oil prices might track lower alongside slumping equities.
Did we get it right with our crude oil and gold forecasts? Get them here to find out!
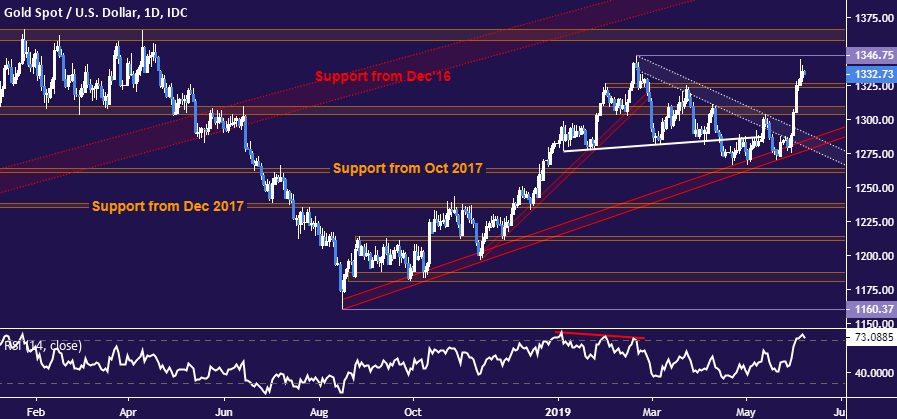
GOLD TECHNICAL ANALYSIS
Gold prices are grinding toward resistance marked by February’s swing high at 1346.75. Breaking above that exposes a trend-defining barrier in the 1357.50-66.06 area. Alternatively, a move back below resistance-turned-support at 1323.40 opens the door for a retest of the 1303.70-09.12 zone.
CRUDE OIL TECHNICAL ANALYSIS
Crude oil prices put in a Bullish Engulfing candlestick pattern on a test of support in the 50.31-51.33 area, hinting that a bounce may be ahead. A daily close above support-turned-resistance at 55.75 exposes the 57.24-88 area. Alternatively, a sustained move below 50.31 sets the stage for a decline to challenge support in play from September 2016 in the 42.05-43.00 zone.

COMMODITY TRADING RESOURCES
- See our guide to learn about the long-term forces driving crude oil prices
- Having trouble with your strategy? Here’s the #1 mistake that traders make
- Join a free webinar and have your commodity market questions answered
--- Written by Ilya Spivak, Currency Strategist for DailyFX.com
To contact Ilya, use the comments section below or @IlyaSpivak on Twitter


