


GOLD & CRUDE OIL TALKING POINTS:
- Gold prices soar as risk aversion stokes Fed rate cut speculation
- ISM data now in focus as USD weighs policy outlook, haven flows
- Crude oil prices slide as US threatens Mexico with import tariffs
Gold prices shot higher Friday as bond yields dropped in risk-off trade, boosting the appeal of non-interest-bearing alternatives. The market mood soured as US President Donald Trump threatened to introduce tariffs on imports from Mexico, which might derail the fledgling USMCA trade pact meant to replace NAFTA.
The US Dollar was unable to find a familiar haven bid amid the turmoil as the move bolstered Fed interest rate cut speculation. That added an anti-fiat element to gold’s appeal, helping to drive the metal upward. Cycle-sensitive crude oil prices plunged alongside stocks.
GOLD EYES US ISM DATA AS US DOLLAR WEIGHS FED OUTLOOK, HAVEN FLOWS
Looking ahead, the US manufacturing ISM survey is in focus on the economic calendar. It is expected to show that the pace of factory-sector activity growth held broadly steady in May after hitting an almost three-year low in April.
US economic news-flow has tended to undershoot baseline forecasts in recently, warning a downside surprise. If such a result reinforces a dovish Fed policy bets, it is likely to be gold-supportive. Data warning that the heretofore resilient US economy is succumbing to global headwinds may also hurt overall risk appetite.
An especially bout of de-risking may see liquidity overshadow returns as investors’ top priority however, reviving the Greenback’s fortunes and capping gold’s advance. The response from crude oil is likely to be more straight-forward, with prices falling in step with shares yet again.
Did we get it right with our crude oil and gold forecasts? Get them here to find out!
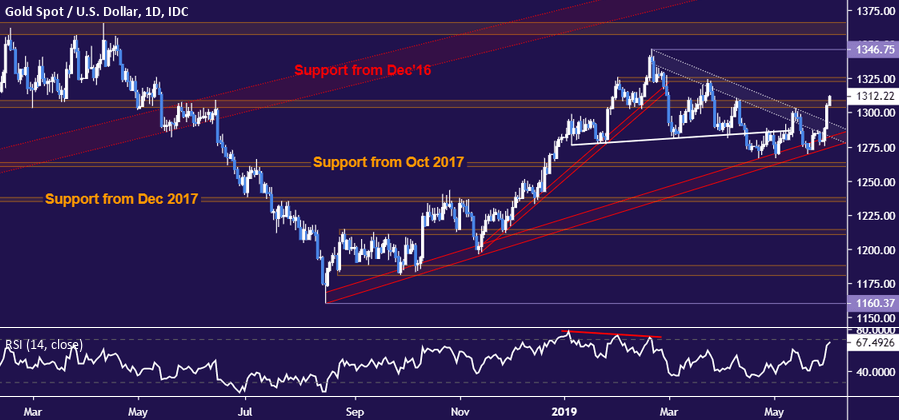
GOLD TECHNICAL ANALYSIS
Gold prices thundered past resistance capping gains since late February, challenging the 1303.70-09.12 area. A break above that confirmed on a daily closing basis exposes the 1323.40-26.30 zone next, followed by the February 20 high at 1346.75. A substantive bearish change in prevailing positioning calls for a close below rising trend support set from mid-August 2018, now at 1274.85.
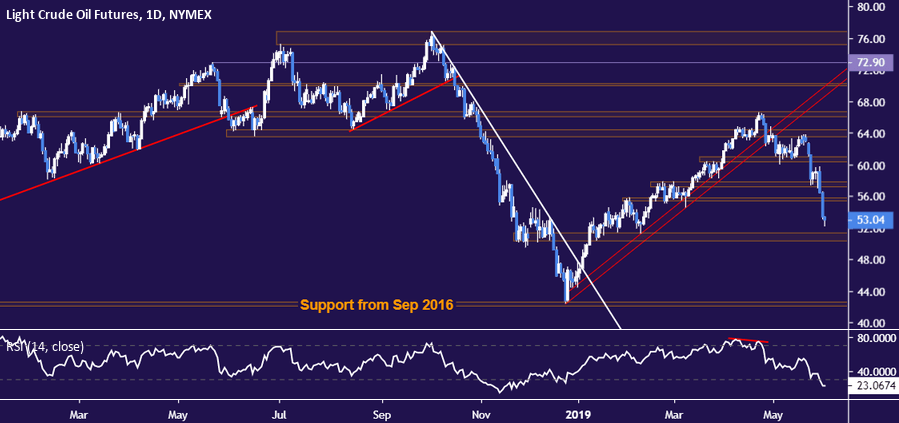
CRUDE OIL TECHNICAL ANALYSIS
Crude oil prices crashed through support in the 55.37-75 area to target the 50.31-51.33 region next. A daily close below that sets the stage for a decline toward support prevailing since September 2016 in the 42.05-43.00 zone. Alternatively, a move back above 55.75, now recast as resistance, targets the 57.24-88 price band.
COMMODITY TRADING RESOURCES
- See our guide to learn about the long-term forces driving crude oil prices
- Having trouble with your strategy? Here’s the #1 mistake that traders make
- Join a free webinar and have your commodity market questions answered
--- Written by Ilya Spivak, Currency Strategist for DailyFX.com
To contact Ilya, use the comments section below or @IlyaSpivak on Twitter


