


CRUDE OIL & GOLD TALKING POINTS:
- Crude oil prices fell with stocks on US-China trade war escalation
- Trump threatened to increase China import tariffs by the week-end
- US carrier deployment to check Iran eyed, Eurozone PMI data due
Crude oil prices are falling alongside S&P 500 futures and Asia Pacific stock exchanges at the start of the trading week signs of US-China trade war escalation sour market-wide sentiment. Gold prices edged up as the defensive mood weighed on bond yields, but the rally quickly stalled as haven demand buoyed the US Dollar, undermining the appeal of anti-fiat alternatives.
Looking ahead, risk trends are likely to overshadow a quiet offering on the economic data front. A revised set of April’s Eurozone PMI data takes top billing and is expected to confirm flash estimates showing manufacturing- and service-sector growth slowed after a shallow uptick in March. Any such outcome is likely to dissolve into broader risk-off dynamics.
Geopolitical complications may muddy crude oil price action after the US deployed an aircraft carrier strike group to the Middle East to counter any would-be aggression from Iran. National security adviser John Bolton said the move was meant to tell Tehran that any attack on US interests or its allies will be met with “unrelenting force”. Washington is expected to hit Iran with additional sanctions within a week.
See the latest gold and crude oil forecasts to learn what will drive prices in the second quarter!
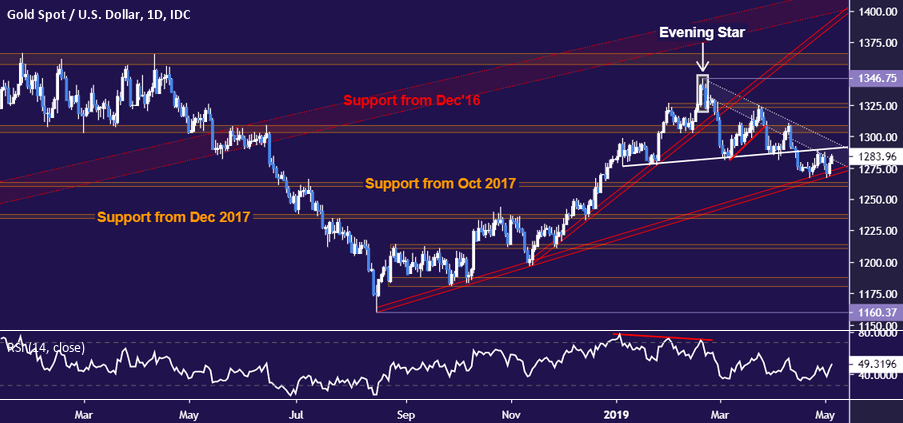
GOLD TECHNICAL ANALYSIS
Gold prices continue to oscillate above support in the 1260.80-63.76 area. A break below this barrier confirmed on a daily closing basis would overturn the rising trend from mid-August 2018, initially exposing the next downside barrier in the 1235.11-38.00 zone. Immediate resistance runs through 1295.37, with a break above that targeting the 1303.70-09.12 region.
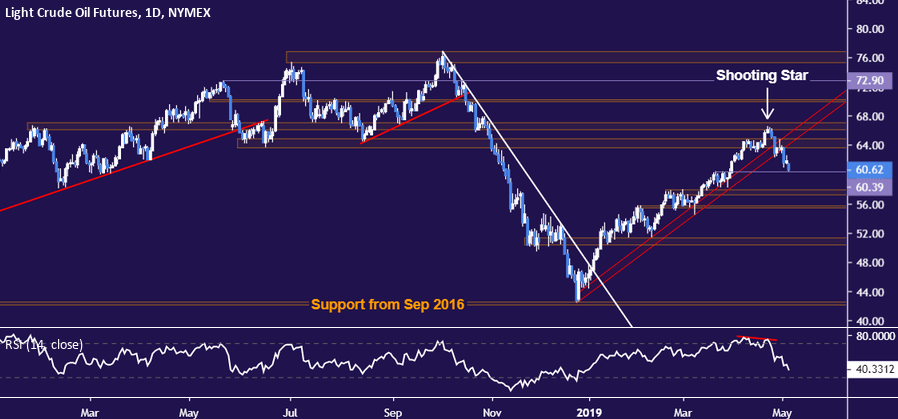
CRUDE OIL TECHNICAL ANALYSIS
Crude oil prices dropped to test minor support at 60.39. A break below that confirmed on a daily closing basis targets the 57.24-88 area next. A dense layer of resistance extends up through 67.03. Reversing back above this barrier opens the door for another challenge of the $70/bbl figure.
COMMODITY TRADING RESOURCES
- See our guide to learn about the long-term forces driving crude oil prices
- Having trouble with your strategy? Here’s the #1 mistake that traders make
- Join a Trading Q&A webinar to answer your commodity market questions
--- Written by Ilya Spivak, Currency Strategist for DailyFX.com
To contact Ilya, use the comments section below or @IlyaSpivak on Twitter


