CRUDE OIL & GOLD TALKING POINTS:
- Crude oil prices narrowly clinging to 2019 trend line support
- Risk-off sentiment, EIA and API data may trigger breakdown
- Gold prices in digestion mode, broad bias still seems bearish
Commodities were in digestion mode on Monday. Crude oil prices consolidated after Friday’s plunge. Gold prices retraced downward, erasing nearly all of the gains scored in the wake of US GDP data. The spotlight now turns to first-quarter Eurozone GDP data.
Growth readings for France, Italy and the currency bloc as a whole are due to cross the wires. Regional news-flow has tended to underperform relative to baseline forecasts, opening the door for disappointing results that stoke global slowdown fears and cool risk appetite.
Cycle-sensitive crude prices may fall against this backdrop. Gold may rise as the defensive mood weighs on bond yields, boosting the comparative appeal of non-interest-bearing alternatives. Gains may be capped if the US Dollar finds support from haven flows, discouraging anti-fiat demand.
Oil prices might face a further pressure as monthly EIA report on output comes across the wires. Leading weekly statistics put US production at a record-high 12.2 million barrels/day. API inventory flow data is also on tap and will be weighed against expectations of a 1.28-million-barrel build last week.
See the latest gold and crude oil forecasts to learn what will drive prices in the second quarter!
GOLD TECHNICAL ANALYSIS
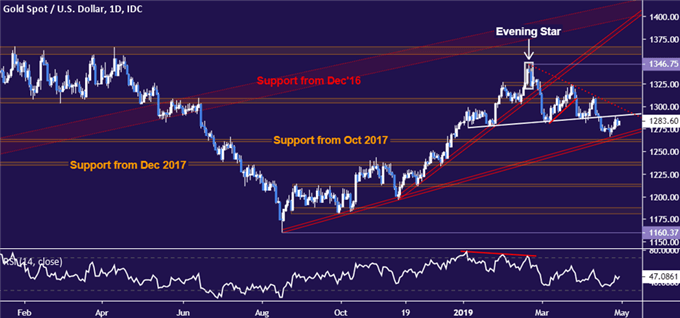
Gold prices remain wedged between support in the 1260.80-63.76 area and resistance marked by the recently broken neckline of a Head and Shoulders (H&S) topping pattern, now at 1290. A break below the former level sees the next downside barrier in the 1235.11-38.00 zone. Alternatively, a push above resistance sets targets the $1300/oz figure. The H&S setup implies an overall downside target at 1215.00.

CRUDE OIL TECHNICAL ANALYSIS
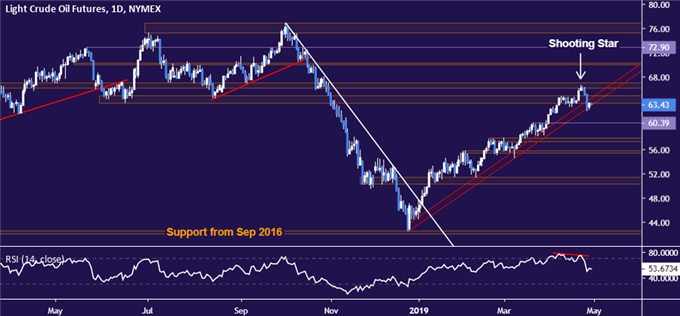
Crude oil prices are idling at trend line support set form December. A daily close below this level – now at 63.30 – initially exposes 60.39. A dense resistance cluster runs through 67.03. A rebound above that, likewise confirmed on a closing basis, sets the stage for a challenge of the $70/bbl figure.

COMMODITY TRADING RESOURCES
- See our guide to learn about the long-term forces driving crude oil prices
- Having trouble with your strategy? Here’s the #1 mistake that traders make
- Join a Trading Q&A webinar to answer your commodity market questions
--- Written by Ilya Spivak, Currency Strategist for DailyFX.com
To contact Ilya, use the comments section below or @IlyaSpivak on Twitter


