


GOLD & CRUDE OIL TALKING POINTS:
- Gold price chart setup hints that a top is taking shape
- Crude oil prices vulnerable to renewed risk aversion
- US retail sales and ISM data, Brexit voting in focus
Gold prices consolidated Friday, with an intraday attempt to build higher fizzling by the session’s close. This seemed to reflect a similarly seesaw session for the US Dollar. The metal frequently trades as an anti-fiat alternative, with price moves tracking inversely of the go-to reserve currency. Crude oil prices rose, tracking stock prices higher as risk appetite narrowly improved.
US DATA, BREXIT VOTES MAY TRANSLATE INTO RISK-OFF BIAS
From here, US retail sales and manufacturing ISM data may revive global slowdown worries if the outcomes echo the recently disappointing trend in macro news-flow. Ominous comments in a scheduled speech from BOC Governor Poloz might compound the downbeat mood. That might sour sentiment and hurt oil. Gold’s ability to capitalize may be stymied if the US Dollar is buoyed by haven demand.
Another round indicative Brexit votes in the UK Parliament is also of note. MPs are struggling to find an option – from a no-deal divorce with the EU to a second referendum that might cancel the rupture altogether – that is agreeable to a majority. Another failure to establish a trajectory may spook investors, making for another argument in favor of a risk-off bias.
Learn what other traders’ gold buy/sell decisions say about the price trend!
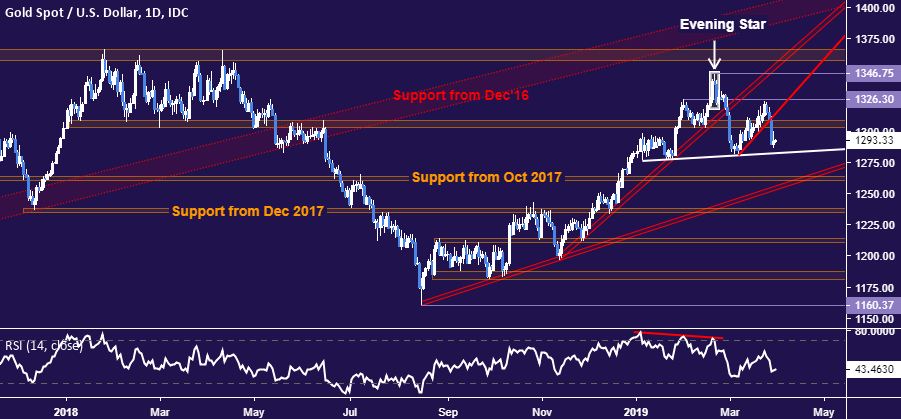
GOLD TECHNICAL ANALYSIS
Gold prices still look to be carving out a bearish Headline and Shoulders chart pattern. Confirmation of the setup on a daily close below neckline support at 1282.83 initially exposes the 1260.80-63.76 area but ultimately implies a descent toward the $1200/oz figure. Alternatively, a turn back above resistance in the 1303.70-09.12 zonetargets 1326.30 next.
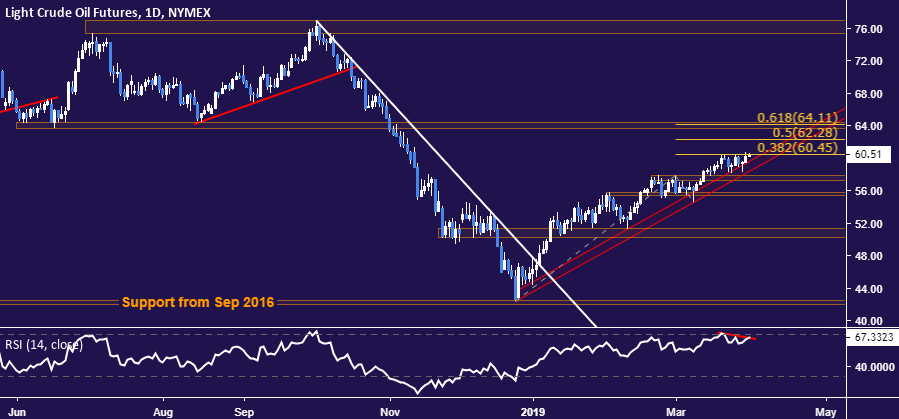
CRUDE OIL TECHNICAL ANALYSIS
Crude oil prices failed to make good on last week’s bearish signaling thus far but the absence of break past range resistance coupled with the appearance of negative RSI divergence warns that a top may yet appear. A reversal below support in 57.24-88 area initially opens the door for a test of the 55.37-75 zone. Alternatively, a daily close above 38.2% Fibonacci expansion at 60.45 eyes the 50% level at 62.28 next.
COMMODITY TRADING RESOURCES
- See our guide to learn about the long-term forces driving crude oil prices
- Having trouble with your strategy? Here’s the #1 mistake that traders make
- Join a Trading Q&A webinar to answer your commodity market questions
--- Written by Ilya Spivak, Currency Strategist for DailyFX.com
To contact Ilya, use the comments section below or @IlyaSpivak on Twitter


