


CRUDE OIL & GOLD TALKING POINTS:
- Crude oil prices drop with stocks amid global slowdown fears
- Gold prices up as yields decline, US Dollar bounce caps rise
- S&P 500 futures suggest risk aversion has scope to continue
Sentiment-sensitive crude oil prices fell alongside stocks on Friday as disappointing PMI data fueled global slowdown fears and stocked risk aversion, as expected. Gold prices managed a tepid rise as bond yields fell, boosting the relative appeal of non-interest-bearing assets. Upside progression was capped as haven-seeking flows buoyed the US Dollar however.
CRUDE OIL PRICES MAY FALL AMID RISK AVERSION
Looking ahead, a muted offering on the economic data docket seems likely to keep the trajectory of broad-based risk appetite as the main driver for price action. Bellwether S&P 500 futures are tellingly pointing lower, suggesting Friday’s risk-off tilt is likely to remain in place. That bodes ill for oil prices. Meanwhile, gold will probably continue to weigh competing influences from bond yields and the Greenback.
Learn what other traders’ gold buy/sell decisions say about the price trend!
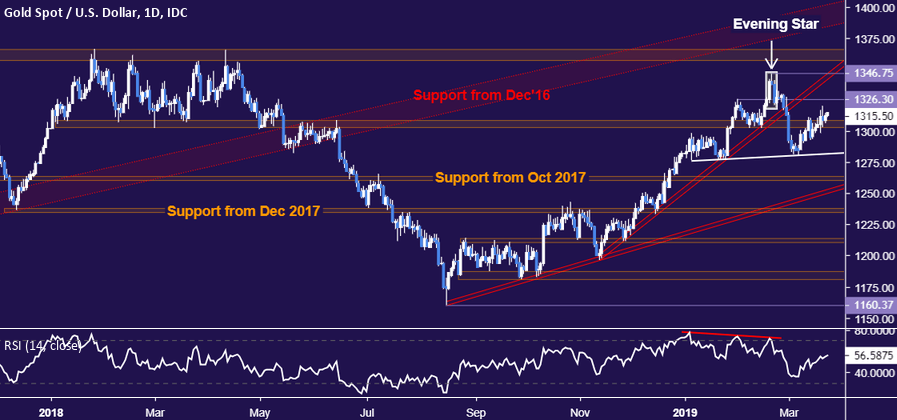
GOLD TECHNICAL ANALYSIS
Gold prices still look to be carving out a somewhat choppy Head and Shoulders top, but confirmation remains absent. Completing the pattern would require a reversal back below the 1303.70-09.12 area, followed by a breach of neckline support at 1282.05. Alternatively, a move above near-term resistance at 1326.30 sets the stage for a retest of the February top at 1346.75.
CRUDE OIL TECHNICAL ANALYSIS
Crude oil prices may be signaling a top with the formation of a bearish Evening Star candlestick pattern. A daily close below initial support in the 57.24-88 area would confirm the setup, initially exposing the 55.37-75 zone next. Alternatively, a push above resistance marked by the 38.2% Fibonacci expansion at 60.45targets the 50% level at 62.28.

COMMODITY TRADING RESOURCES
- See our guide to learn about the long-term forces driving crude oil prices
- Having trouble with your strategy? Here’s the #1 mistake that traders make
- Join a Trading Q&A webinar to answer your commodity market questions
--- Written by Ilya Spivak, Currency Strategist for DailyFX.com
To contact Ilya, use the comments section below or @IlyaSpivak on Twitter


