


CRUDE OIL & GOLD TALKING POINTS:
- Crude oil price chart still warning of ebbing upside momentum
- EIA inventory flow data on tap, baseline envisions modest build
- Gold prices may struggle for direction before FOMC rate call
Crude oil prices rose Monday, with the cycle-sensitive commodity tracking broadly in line with a pickup in risk appetite. The bellwether S&P 500 stock index rose for a second day, closing at a five-month high. It probably didn’t hurt that OPEC+ officials recommitted themselves to a coordinated output cut scheme, even though the decision to extend it past mid-year looks to have been delayed until June.
Gold prices were little-changed, edging narrowly higher but ultimately failing to make headway past familiar near-term ranges. The standstill probably echoes similar torpor in Treasury bond yields and the US Dollar as the markets wait for Wednesday’s FOMC rate decision before committing to a directional bias on assets driven by the outlook for monetary policy.
US DURABLE GOODS AND FACTORY ORDERS, API OIL INVENTORY STATS DUE
Looking ahead, oil is eyeing weekly API inventory flow data. It will be judged against bets on a modest 632k inflow expected to be reported in official EIA statistics later in the week. Gold might see a bit of near-term volatility as US durable goods and factory orders figures are released but lasting follow-through is probably unlikely until Fed Chair Powell and company have had their say.
See our guide to learn about the long-term forces driving crude oil prices !
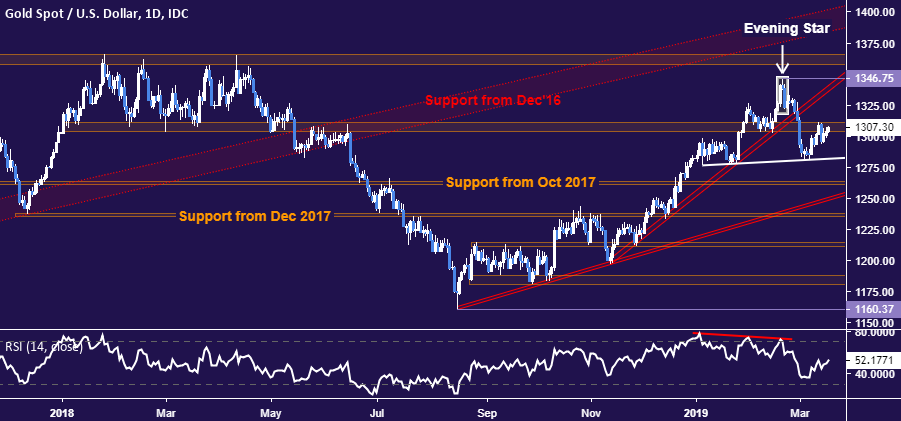
GOLD TECHNICAL ANALYSIS
Gold prices might be carving out a choppy Head and Shoulders top below $1350/oz. A daily close below neckline support – now at 1282.11 – would act as confirmation, initially exposing the 1260.80-63.76 area but broadly implying a larger decline toward 1220. Alternatively, a daily close above resistance in the 1303.70-10.95 region opens the door for a move to revisit the February swing top at 1346.75.
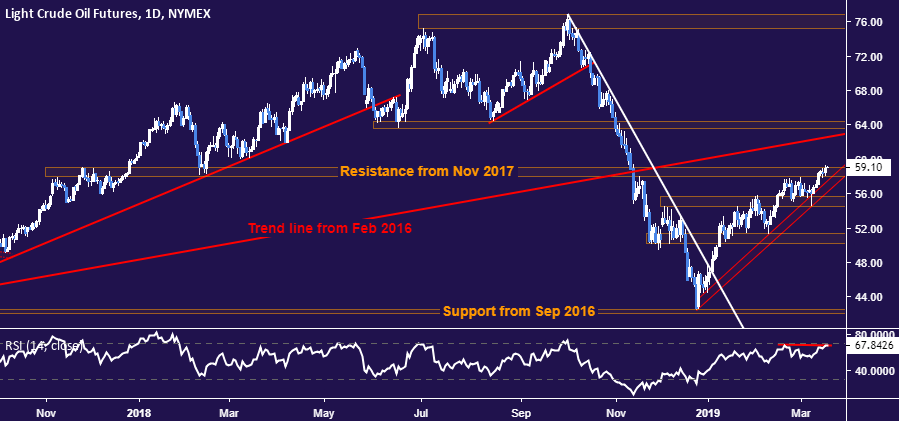
CRUDE OIL TECHNICAL ANALYSIS
Crude oil prices fell just shy of breaking resistance in the 57.96-59.05 area. Meanwhile, negative RSI divergence continues to warn of a bearish reversal in the works. A daily close below support in the 54.55-55.66 area sets the stage for a test of the 50.15-51.33 zone. Alternatively, a confirmed break higher paves the way for a retest of trend line support-turned-resistance a trend line set from February 2016, now at 62.63.
COMMODITY TRADING RESOURCES
- Learn what other traders’ gold buy/sell decisions say about the price trend
- Having trouble with your strategy? Here’s the #1 mistake that traders make
- Join a Trading Q&A webinar to answer your commodity market questions
--- Written by Ilya Spivak, Currency Strategist for DailyFX.com
To contact Ilya, use the comments section below or @IlyaSpivak on Twitter


