


CRUDE OIL & GOLD TALKING POINTS:
- Crude oil prices drop with stocks amid broad-based risk aversion
- EIA outlook report, API inventory flow data in the spotlight next
- Gold prices may fall as yields rise on US PPI, sentiment recovery
Crude oil prices fell alongside shares amid broad-based deterioration in risk appetite yesterday. Gold prices edged up as the markets’ dour mood stoked haven demand for government bonds and drove yields downward, boosting the relative appeal of non-interest-bearing assets epitomized by the yellow metal. Neither commodity made headway beyond recently prevailing trading ranges however (see charts below).
CRUDE OIL EYES EIA AND API DATA, GOLD MAY FALL AS YIELDS RISE
Looking ahead, the EIA Short-Term Energy Outlook report is on tap. The former seems likely to suggest that the narrowing of the gap between US demand and supply will continue, amounting to a headwind for prices. The latest leg in the long-term contraction of the shortfall needed to be made up with imports started in June 2017. It registered at a record-low 8.5 million barrels in September.
API crude oil inventory flow data is also due. It will be sized up against expectations calling for a 1.3-million-barrel drawdown to be reported in official DOE statistics on Wednesday. A larger outflow may boost prices while a smaller one – or even an unexpected build – might pressure them downward.
Meanwhile, a jump in wholesale inflation might help inspire a rethink of the recent dovish shift in Fed policy bets. The core US PPI reading is expected to rise to 3 percent on-year, amounting the fastest rise in factory-gate prices since August 2011. Bellwether S&P 500 futures are on the upswing, hinting that this might be coupled with a sentiment-driven rise in yields. Taken together, this spells trouble for gold.
See our guide to learn about the long-term forces driving crude oil prices !
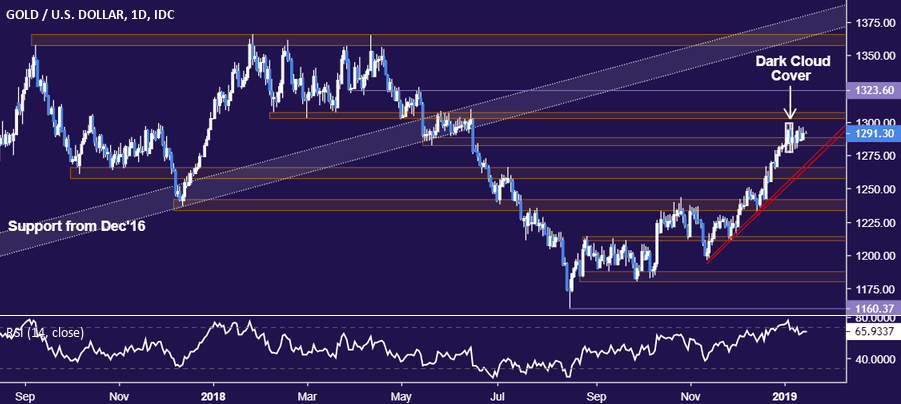
GOLD TECHNICAL ANALYSIS
Gold prices are treading water, but a bearish Dark Cloud Cover candlestick pattern still hints that a top is in the works. A break below support at 1282.27 initially exposes the 1257.60-66.44 area (former resistance, rising trend line). Alternatively, a daily close above the 1302.97-07.32 region targets minor resistance at 1323.60, followed by a pivotal barrier in the 1357.50-66.06 zone.
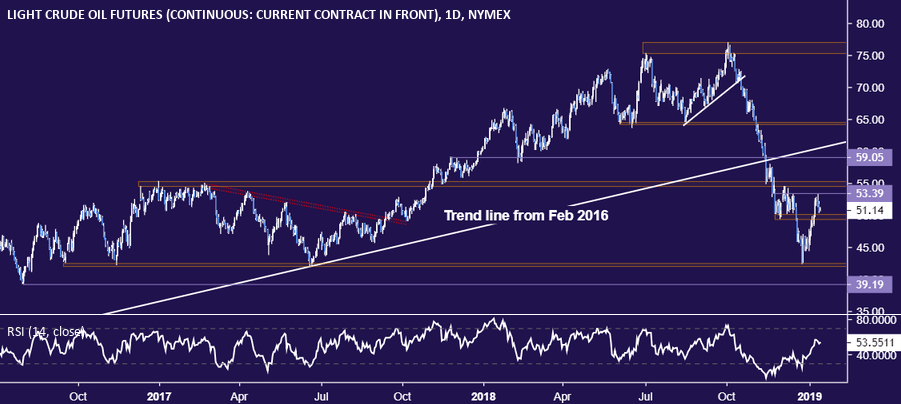
CRUDE OIL TECHNICAL ANALYSIS
Crude oil prices pulled back from minor resistance at 53.39 to retest support-turned-resistance in the 49.41-50.15 zone. A daily close below broadly exposes the 42.05-55 region. Alternatively, a push upward that overcomes the 54.51-55.24 area paves the way for a test of 59.05.
COMMODITY TRADING RESOURCES
- Learn what other traders’ gold buy/sell decisions say about the price trend
- Having trouble with your strategy? Here’s the #1 mistake that traders make
- Join a Trading Q&A webinar to answer your commodity market questions
--- Written by Ilya Spivak, Currency Strategist for DailyFX.com
To contact Ilya, use the comments section below or @IlyaSpivak on Twitter


