GOLD & CRUDE OIL TALKING POINTS:
- Crude oil prices sink as EIA shows US output hit a record high in August
- WTI contract rejected at trend resistance, menacing support above $64/bbl
- Gold prices may drop further as ISM data boosts Fed rate hike prospects
Gold prices continued to fall as recovering risk appetite sent Treasury bond yields higher alongside stocks while the 2019 rate hike outlook implied in Fed Funds futures steepened. That understandably undermined the appeal of non-interest-bearing assets.
Typically pro-risk crude oil prices failed to capitalize however. An EIA report revealed that the US became the world’s largest producer in August, delivering a record-setting 11.35 million barrels per day. A separate release showed inventories added 3.22 million barrels last week, topping consensus forecasts.
GOLD PRICES MAY FALL FURTHER ON US ISM DATA
Looking ahead, October’s US manufacturing ISM survey is on tap. A slight slowdown in overall sector activity is expected but the main takeaway from the release might be a dramatic jump in costs growth. Forecasts are calling for the largest rise since March after four consecutive months of deceleration.
That might stoke bets on acceleration in broader inflation, encouraging a hawkish shift in Fed policy bets and punishing gold further. A spirited upswing in S&P 500 futures hints at continued risk-on progress that might compound the yellow metal’s losses. Oil prices might muster a corrective rise against this backdrop.
Learn what other traders’ gold buy/sell decisions say about the price trend!
GOLD TECHNICAL ANALYSIS
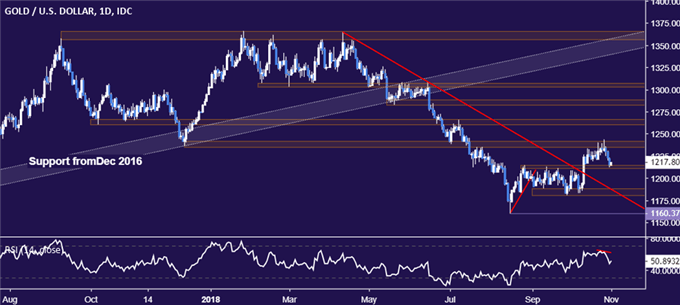
Gold prices are retreating from resistance in the 1235.24-41.64 area, as expected. A daily close below initial support in the 1211.05-14.30 zone exposes the 1180.86-87.83 region. Alternatively, a sustained recovery above 1241.64 sees the next upside threshold in the 1260.80-66.44 region.

CRUDE OIL TECHNICAL ANALYSIS
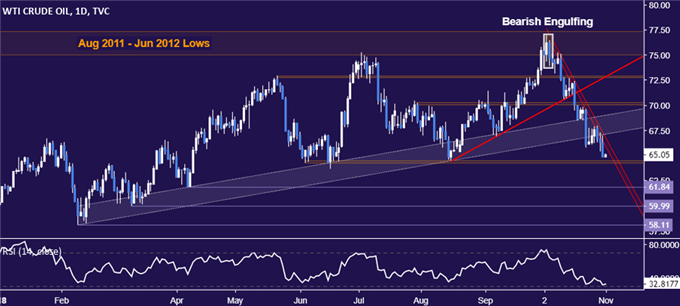
Crude oil prices are menacing support in the 64.26-45 area, with a daily close below that exposing 61.84. A seemingly durable layer of resistance begins at 67.08, with a break above that opening the door for a test of the next upside threshold at 68.95. Longer-term chart positioning hints a major top is in the works.

COMMODITY TRADING RESOURCES
- See our guide to learn about the long-term forces driving crude oil prices
- Having trouble with your strategy? Here’s the #1 mistake that traders make
- Join a Trading Q&A webinar to answer your commodity market questions
--- Written by Ilya Spivak, Currency Strategist for DailyFX.com
To contact Ilya, use the comments section below or @IlyaSpivak on Twitter


