


GOLD & CRUDE OIL TALKING POINTS:
- Gold prices mark time despite US Dollar, Treasury yield pullback
- Modest crude oil price bounce leaves bearish technical cues intact
- US PPI, EIA short-term outlook report, API inventories data due
Gold prices marked time yesterday despite a parallel pullback in the US Dollar and Treasury bond yields, which might have been expected to boost the anti-fiat yellow metal. That gains did not materialize is perhaps indicative of the move’s corrective character, reflecting protective pre-positioning before upcoming US inflation data after last week’s steepening of the priced-in Fed rate hike path.
From here, the spotlight turns to September’s US PPI data. The headline wholesale inflation rate is expected to tick down from 2.8 to 2.7 percent on-year. The measure excluding volatile food and energy prices to get at the core trend is seen pushing up to 2.5 percent however. An upside surprise echoing recent improvement in US data relative to forecasts may boost the greenback, pressuring gold downward.
CRUDE OIL MAY FALL ON EIA REPORT, API INVENTORY DATA
As for crude oil prices, a cautious upswing yesterday failed to pull prices out of the congestion range prevailing since last Friday (see chart below). The monthly EIA Short-Term Energy Outlook (STEO) report as well as API inventory flow statistics are now in focus. The latter release will serve to foreshadow official DOE inventory figures due Thursday.
The EIA report may highlight the downshift in demand (including exports) against a backdrop of swelling production, which now stands at a record-high 11.1 million barrels per day. That has understandably translated into growing stockpiles since mid-September, and more of the same is expected this time around. If API puts the latest increase at greater than the 2.1 million barrels expected, prices may track lower.
Learn what other traders’ gold buy/sell decisions say about the price trend!
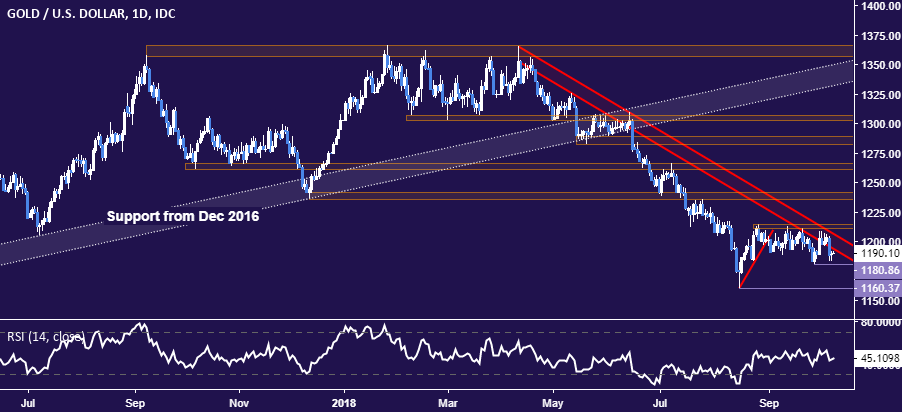
GOLD TECHNICAL ANALYSIS
Gold prices are hovering above support at 1180.86 – the September 28 low – having retreated following a test of downtrend resistance set from mid-April. A daily close below this barrier paves the way for a test of the mid-August bottom at 1160.37. Alternatively, a break above 1214.30 would neutralize the near-term bearish bias and expose the 1235.24-41.64 zone as the next upside hurdle.
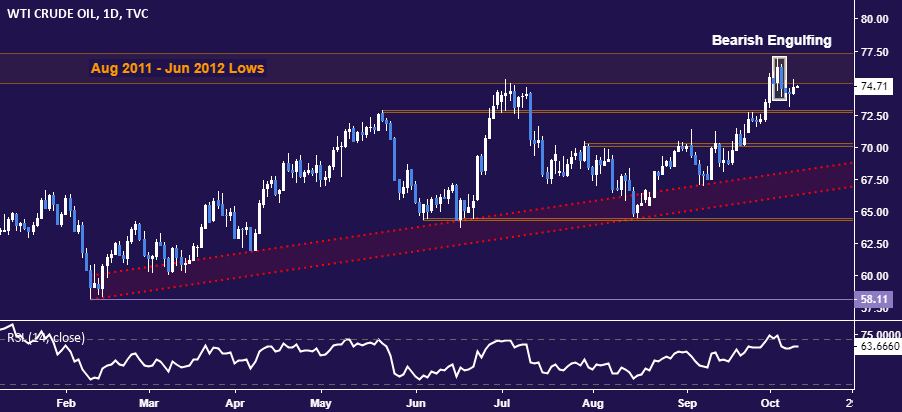
CRUDE OIL TECHNICAL ANALYSIS
Crude oil prices continue stall above near-term support but a Bearish Engulfing candlestick pattern still warns that a top is taking shape. In fact, longer-term chart positioning hints a structural trend reversal may be in the offing. A daily close below the 72.73-88 area sees the next downside barrier in the 70.05-26 zone. Resistance remains in the 75.00-77.31 region (August 2011 – June 2012 lows).
COMMODITY TRADING RESOURCES
- See our guide to learn about the long-term forces driving crude oil prices
- Having trouble with your strategy? Here’s the #1 mistake that traders make
- Join a Trading Q&A webinar to answer your commodity market questions
--- Written by Ilya Spivak, Currency Strategist for DailyFX.com
To contact Ilya, use the comments section below or @IlyaSpivak on Twitter


