


CRUDE OIL & GOLD TALKING POINTS:
- Crude oil prices may decline as risk aversion sweeps markets
- Gold prices’ latest drop may not find near term follow-though
Crude oil prices marked time Monday as a lull in top-tier event risk allowed space for consolidating recent losses. Gold prices dropped to the bottom of their recent range but the move failed to produce a clear-cut directional break. Furthermore, the move seemed to lack clear-cut fundamental impetus, hinting warning against overestimating scope for immediate follow-through.
GOLD MAY RISE AS CRUDE OIL FALLS IN RISK-OFF TRADE
From here, another quiet day on the economic data docket might put prevailing sentiment trends in focus. Shares edged lower in Asia Pacific trade and bellwether S&P 500 futures are pointing downward, hinting at a risk-off bias. This might reflect a worried tone from the IMF, which cited trade tensions in cutting its global growth outlook for the first time in two years.
If risk aversion continues to build, gold prices may find scope for something of a recovery as falling bond yields boost the relative appeal of non-interest-bearing assets. Gains may be capped if the US Dollar benefits from haven-seeking flows anew however. The response from cycle-sensitive crude oil prices may be more straightforwardly negative.
See our guide to learn about the long-term forces driving crude oil prices !
GOLD TECHNICAL ANALYSIS
Gold prices recoiled from resistance at 1214.30 (range top, trend line set from mid-April), menacing support marked by the September 28 low at 1180.86 once again. A daily close below that opens the door for a test of the mid-August bottom at 1160.37. Alternatively, a push above 1214.30 targets the 1235.24-41.64 zone.

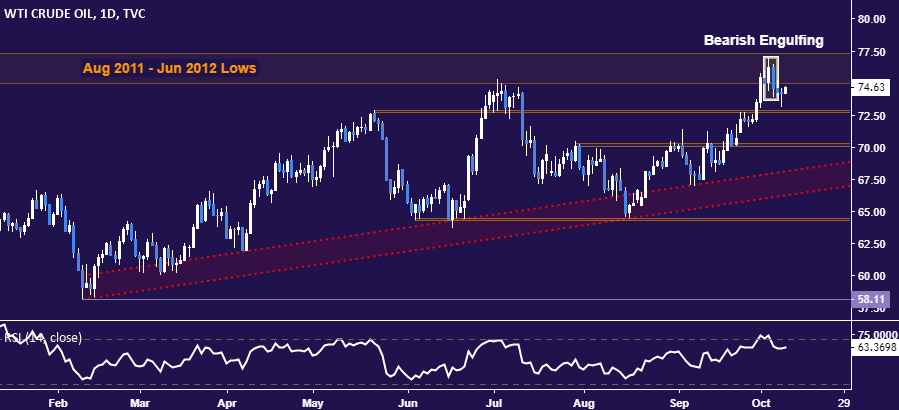
CRUDE OIL TECHNICAL ANALYSIS
Crude oil prices paused to digest losses but a Bearish Engulfing candlestick pattern continues hint at topping. From here, a daily close below the 72.73-88 area exposes the 70.05-26 zone. Resistance remains in the 75.00-77.31 region (August 2011 – June 2012 lows). Longer-term chart positioning warns that a structural trend change may be in the works.
COMMODITY TRADING RESOURCES
- Learn what other traders’ gold buy/sell decisions say about the price trend
- Having trouble with your strategy? Here’s the #1 mistake that traders make
- Join a Trading Q&A webinar to answer your commodity market questions
--- Written by Ilya Spivak, Currency Strategist for DailyFX.com
To contact Ilya, use the comments section below or @IlyaSpivak on Twitter


