


CRUDE OIL & GOLD TALKING POINTS:
- Saudi Arabia reportedly comfortable with crude oil prices above $80/bbl
- Gold prices echo seesaw US Dollar moves after latest Trump tariff hike
- EIA inventory flow data and pre-positioning for FOMC meeting in focus
Crude oil prices soared reports circulated around the markets citing unnamed Saudi Arabia sources as saying the kingdom is comfortable with prices north of $80/barrel. That implies the top producer will not step up output to cap even a substantive rise from current levels.
Gold prices oscillated, with the standby anti-fiat asset echoing directionless volatility of the US Dollar. The currency fell against sentiment-geared commodity currencies as risk appetite curiously firmed after the US hit China with more tariffs. It rose against the anti-risk Yen and lower-yielding European FX however.
EIA INVENTORY DATA DUE, GOLD MAY FALL BEFORE FOMC
Looking ahead, EIA inventory flow data is in focus. Economists expect storage to have shed 2.62 million barrels last week. An analogous private-sector estimate from API predicted an increase of 1.25 million barrels, opening the door for an adverse surprise that might send oil prices lower.
Meanwhile, gold might fall amid pre-positioning for next week’s FOMC rate decision. Results from yesterday’s 4-week US note sale put prevailing yields at a decade high even as the bid-to-cover demand gauge hit the highest level since January, suggesting the markets are setting up for a hawkish posture.
See our guide to learn about the long-term forces driving crude oil prices !
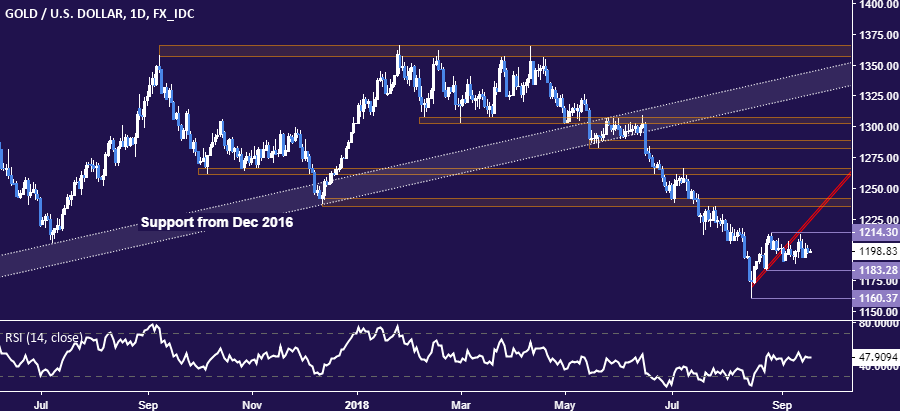
GOLD TECHNICAL ANALYSIS
Gold prices continue to consolidate below the August 28 high at 1214.30. A daily close above this targets support-turned-resistance in the 1235.24-41.64 area. Alternatively, a move below the August 24 lowat 1183.28 exposes the swing bottom at 1160.37.
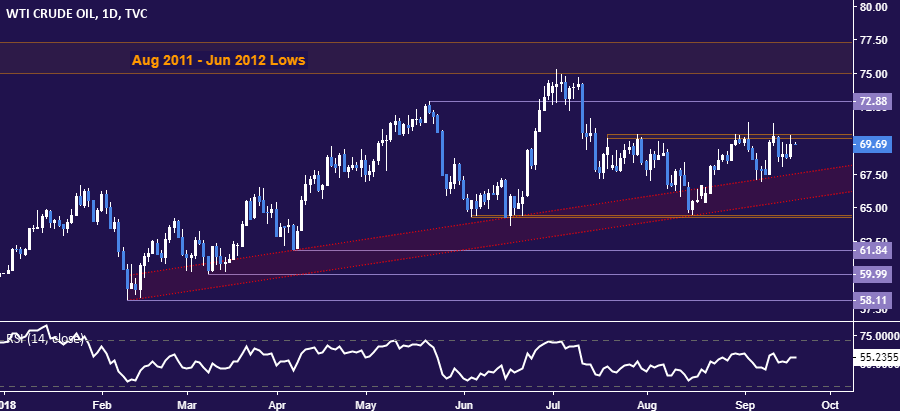
CRUDE OIL TECHNICAL ANALYSIS
Crude oil prices remain in digestion mode below resistance in the 70.15-41 area. A daily close below rising trend support in the 65.62-67.50 zone opens the door for a challenge of the 64.26-45 region. Alternatively, a push above resistance sees the next upside threshold marked by a chart inflection point at 72.88.
COMMODITY TRADING RESOURCES
- Learn what other traders’ gold buy/sell decisions say about the price trend
- Having trouble with your strategy? Here’s the #1 mistake that traders make
- Join a Trading Q&A webinar to answer your commodity market questions
--- Written by Ilya Spivak, Currency Strategist for DailyFX.com
To contact Ilya, use the comments section below or @IlyaSpivak on Twitter


