


GOLD & CRUDE OIL TALKING POINTS:
- Gold prices rise to near-term range top as the US Dollar retreats
- Crude oil prices spike on EIA data but follow-through evaporates
- Augusts’ US CPI figures, IEA monthly report now in the spotlight
Gold prices rose as the US Dollar fell, boosting the relative appeal of anti-fiat assets epitomized by the yellow metal. Crude oil prices spiked to a one-week high intraday as EIA inventory data showed a larger than expected drawdown of nearly 5.3 million barrels. The lion’s share of gains evaporated by day’s end however, perhaps because an outsized draw was already telegraphed in API data.
US CPI DATA, IEA MONTHLY REPORT IN FOCUS
From here, the spotlight turns to US CPI data. The headline on-year inflation rate is expected to tick down to 2.8 percent in August after hitting a six-year high of 2.9 percent in July. An upside surprise echoing last month’s surge in wage growth may drive a hawkish shift in Fed interest rate hike expectations, reviving the greenback’s fortunes and weighing on gold prices by extension.
Meanwhile, oil traders will look to a monthly report from the IEA to inform supply and demand projections. An analogous release from OPEC yesterday sounded a worried tone, identifying a range of “challenges” –trade wars, monetary tightening and emerging markets jitters – that might hurt demand. A similarly cautious stance in today’s release may weigh on prices.
Learn what other traders’ gold buy/sell decisions say about the price trend!
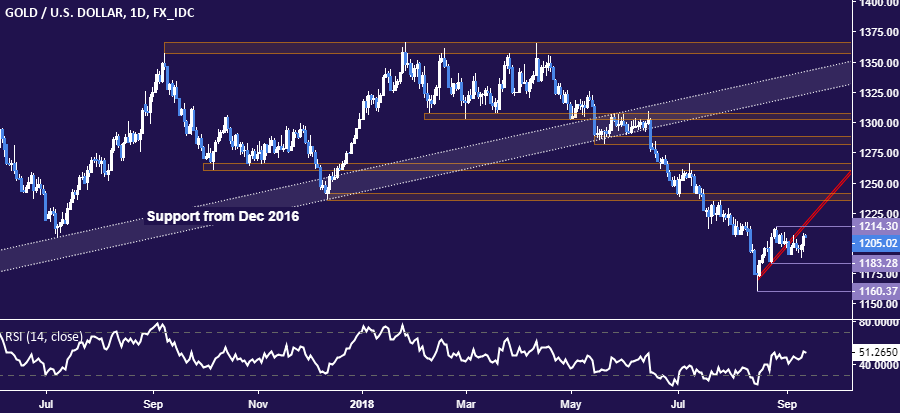
GOLD TECHNICAL ANALYSIS
Gold prices are in digestion mode after breaking counter-trend support, implying downtrend resumption is in the works. From here, a daily close below theAugust 24 lowat 1183.28 initially exposes the swing bottom at 1160.37. Alternatively, a turn back above 1214.30, the August 28 high, opens the door for a retest of support-turned-resistance in the 1235.24-41.64 area.
CRUDE OIL TECHNICAL ANALYSIS
Crude oil prices continue to test resistance in the 70.15-41 area, with a break above that confirmed on a daily closing basis exposing the chart inflection point at 72.88. Rising trend support guiding the move higher since early February is now in the 65.41-67.26 zone.

COMMODITY TRADING RESOURCES
- See our guide to learn about the long-term forces driving crude oil prices
- Having trouble with your strategy? Here’s the #1 mistake that traders make
- Join a Trading Q&A webinar to answer your commodity market questions
--- Written by Ilya Spivak, Currency Strategist for DailyFX.com
To contact Ilya, use the comments section below or @IlyaSpivak on Twitter


