


GOLD & CRUDE OIL TALKING POINTS:
- Gold prices fall as US Dollar gains on upbeat jobs data
- Crude oil seesaws on US payrolls, IEA demand outlook
- Risk recovery may offer a lifeline, Fed’s Bostic to speak
Gold prices swooned as upbeat labor-market data sent the US Dollar higher alongside Treasury bond yields, tarnishing the appeal of anti-fiat and non-interest-bearing alternatives (as expected). Payrolls growth topped forecasts and wage inflation outperformed forecasts, soaring to 2.9 percent.
Crude oil prices also fell as USD strength echoed across assets denominated in terms of the benchmark currency on global markets. A swift recovery erased most of the drop however after IEA Director Fatih Birol said emerging market turmoil will not derail demand in a decisive way, predicting tighter conditions.
RISK RECOVERY MAY HELP COMMODITIES, FED’s BOSTIC TO SPEAK
Looking ahead, a relatively dull offering on the economic calendar might allow commodities prices a bit of room to consolidate. A recovery in risk appetite might help. Indeed, futures tracking the FTSE 100 and S&P 500 equities benchmarks are pointing conspicuously higher before London and New York come online.
Fed-speak might emerge as another catalyst. Scheduled commentary from Atlanta Fed President Raphael Bostic is due to cross the wires, making him among the first to opine on Friday’s jobs data. Remarks signaling greater conviction in the need for steeper rate hikes may add to Dollar gains, hurting gold.
Learn what other traders’ gold buy/sell decisions say about the price trend!
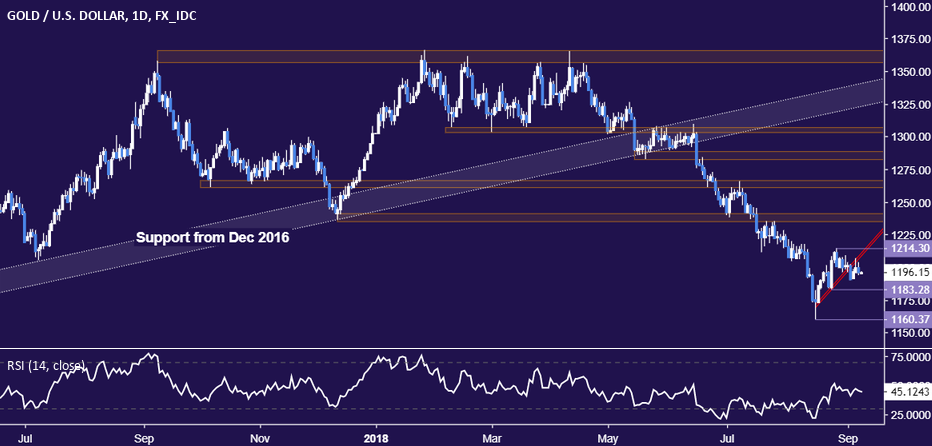
GOLD TECHNICAL ANALYSIS
Gold prices turned lower following a retest of recently broken countertrend support, bolstering the case for downtrend resumption. From here, a break below theAugust 24 lowat 1183.28 on a daily closing basis exposes swing bottom at 1160.37. Alternatively, a turn back above the August 28 high at 1214.30 opens the door for another challenge of 1235.24-41.64 area.
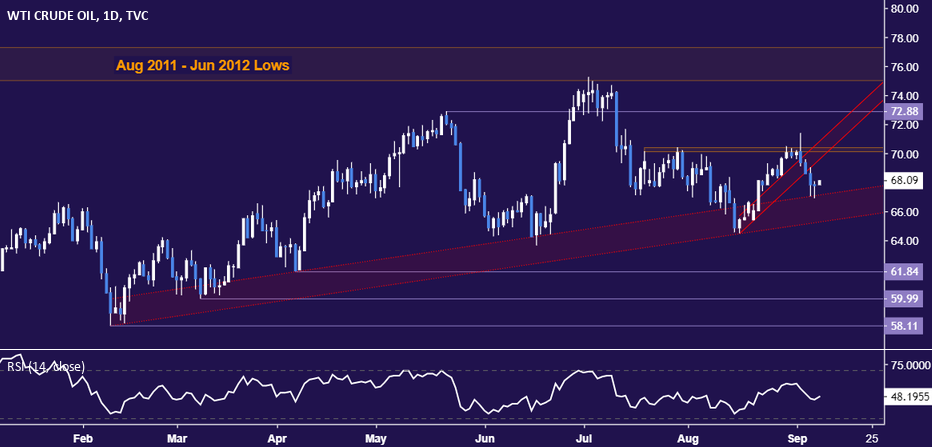
CRUDE OIL TECHNICAL ANALYSIS
Crude oil prices are digesting losses at support defining the rising trend since early February, now in the 65.29-67.16 area. A daily close below its lower layer paves the way for a test of 61.84. The 70.15-41 region continues to mark resistance, with a push above that targeting the chart inflection point at 72.88.
COMMODITY TRADING RESOURCES
- See our guide to learn about the long-term forces driving crude oil prices
- Having trouble with your strategy? Here’s the #1 mistake that traders make
- Join a Trading Q&A webinar to answer your commodity market questions
--- Written by Ilya Spivak, Currency Strategist for DailyFX.com
To contact Ilya, use the comments section below or @IlyaSpivak on Twitter


