


GOLD & CRUDE OIL TALKING POINTS:
- Gold prices rise for third day as US Dollar pullback continues
- Crude oil prices higher as China suspends shipments from Iran
- August FOMC meeting minutes, EIA inventory flow data on tap
Gold prices rose for a third consecutive day as improving risk appetite continued to weigh on the US Dollar, forcing the currency to retrace recent gains scored against a backdrop of risk aversion. That has understandably bolstered the appeal of the perennially anti-fiat yellow metal.
Meanwhile, crude oil prices shot higher after ship-tracking data compiled and reported by Bloomberg showed that Chinese vessels stopped hauling Iranian product as of July. Separately, French energy giant Total advised Iran that it will withdraw from developing the South Pars oil field.
FOMC MEETING MINUTES, EIA INVENTORY DATA IN FOCUS
From here, the release of minutes from Augusts’ FOMC meeting is in focus. The statement released following that sit-down was decidedly hawkish. More of the same in the account of the proceedings might revive the US Dollar’s fortunes, weighing on gold prices by extension.
As for oil, it is likely to focus on EIA inventory data. A leading private-sector estimate from API called for a 5.17 million barrel draw as week, an outcome well in excess of the 1.86 million barrel outflow expected to be shown today. If that proves to foreshadow an upside surprise, prices may rise.
Learn what other traders’ gold buy/sell decisions say about the price trend!
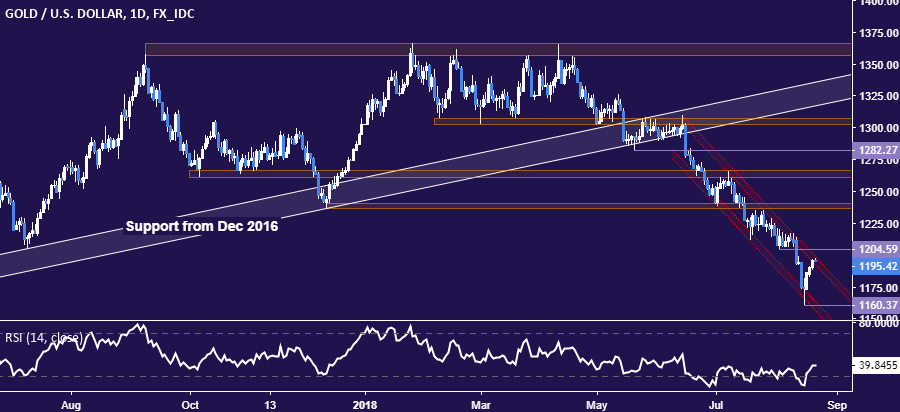
GOLD TECHNICAL ANALYSIS
Gold prices are testing resistance guiding the down move from mid-June. From here, a break above support-turned-resistance at 1204.59 exposes the 1236.66-40.86 area. Near-term support continues to be at 1160.37, the August 16 low.
CRUDE OIL TECHNICAL ANALYSIS
Crude oil prices continue to mark time above support in the 63.96-64.26 area. A daily close below that sees the next downside barrier at 61.84. Alternatively, a push above trend line support-turned-resistance at 68.72 opens the door for a retest of the 69.89-70.41 zone.

COMMODITY TRADING RESOURCES
- See our guide to learn about the long-term forces driving crude oil prices
- Having trouble with your strategy? Here’s the #1 mistake that traders make
- Join a Trading Q&A webinar to answer your commodity market questions
--- Written by Ilya Spivak, Currency Strategist for DailyFX.com
To contact Ilya, use the comments section below or @IlyaSpivak on Twitter


