


GOLD & CRUDE OIL TALKING POINTS:
- Commodity prices drop in tandem amid broad-based risk aversion
- Crude oil faces added pressure as EIA report shock inventory build
- US/China trade war breakthrough hopes fuel sentiment recovery
A wave of selling hit the commodities space yesterday as worries about escalating tensions between the US and Turkey soured investors’ mood across financial markets. Crude oil and gold prices fell alongside the MSCI Emerging Markets stock index – which suffered the largest one-day drop in five months – as well as the broader S&P 500 benchmark.
Oil prices’ descent was amplified by EIA inventory flow data, which showed that US stockpiles unexpectedly added 6.81 million barrels last week. That marks the largest increase in seven months. The outcome echoed an API estimate published yesterday, disappointing analysts’ consensus forecast calling for a 2.9 million barrel drawdown.
OIL, GOLD MAY RISE ON HOPES FOR US/CHINA TRADE WAR BREAKTHOUGH
From here, a dull offering of economic data is likely to keep sentiment front and center. Risk appetite is on the mend in Asia Pacific hours amid hopes for a breakthrough in US/China trade relations. That follows news that China’s Vice Commerce Minister will travel to the US for high-level talks in late August.
Futures tracking the FTSE 100 and S&P 500 are pointing decidedly higher before London and New York come online, hinting the chipper mood has scope for follow-through. Commodity prices may broadly recover in such a scenario as markets unwind at least some of the prior day’s catch-all slump.
Learn what other traders’ gold buy/sell decisions say about the price trend!
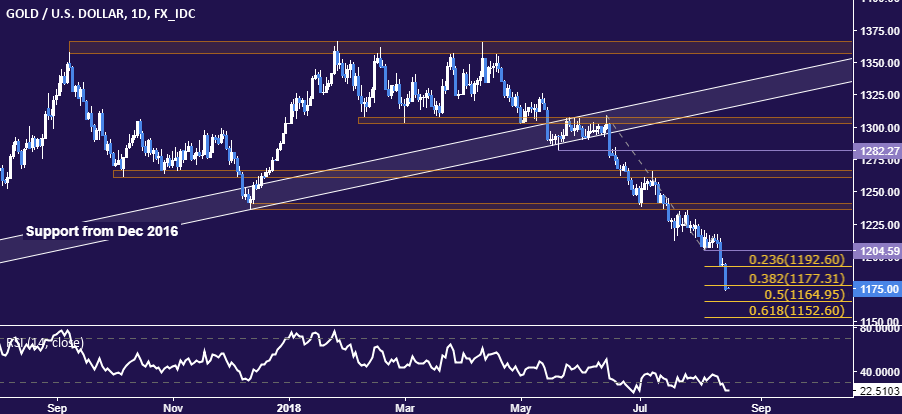
GOLD TECHNICAL ANALYSIS
Gold prices leapt lower again after a brief pause. Support is now at 1164.95, the 50% Fibonacci expansion. Breaking below that on a daily closing basis targets the 61.8% level at 1152.60 next. Alternatively, a reversal back above the 38.2% Fib at 1177.31 opens the door for a retest of the 23.6% expansion at 1192.60.
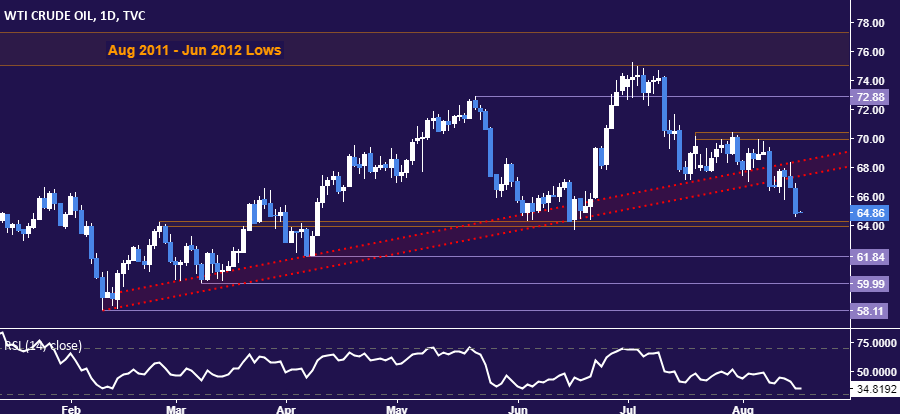
CRUDE OIL TECHNICAL ANALYSIS
Crude oil prices accelerated lower, with sellers now eyeing support in the 63.96-64.26 area. A daily close below that sees the next downside barrier at 61.84. Alternatively, a reversal back above the upper layer of support-turned-resistance set from early February – now at 68.42 - exposes the 69.89-70.41 zone.
COMMODITY TRADING RESOURCES
- See our guide to learn about the long-term forces driving crude oil prices
- Having trouble with your strategy? Here’s the #1 mistake that traders make
- Join a Trading Q&A webinar to answer your commodity market questions
--- Written by Ilya Spivak, Currency Strategist for DailyFX.com
To contact Ilya, use the comments section below or @IlyaSpivak on Twitter


