


CRUDE OIL & GOLD TALKING POINTS:
- Crude oil prices may fall further on EIA report
- Gold prices digest losses after dramatic selloff
- TIC data may overshadow retail sales statistics
Crude oil prices swung lower as members of a UK union at three Total-owned rigs agreed to negotiations on hours and pay following a series of strikes. The news hinted at the possibility that further supply disruption might be avoided. The down move as amplified as API reported that US inventories unexpectedly added 3.66 million barrels last week. Gold prices stalled as markets digested the prior day’s losses.
EIA AND TIC REPORTS IN FOCUS, RETAIL SALES DATA MAY PASS QUIETLY
The spotlight now turns to the official set of EIA inventory flow statistics, where economists expect to see an outflow of 2.89 million barrels. An outcome that registers closer to the API projection might apply further downside pressure on prices. As for gold, it might find a bit of a lifeline if TIC data hints strong foreign demand for US securities might cap yields even as the Treasury steps up debt issuance. Retail sales figures might pass with little fanfare considering their limited implications for near-term Fed policy bets.
See our guide to learn about the long-term forces driving crude oil prices !
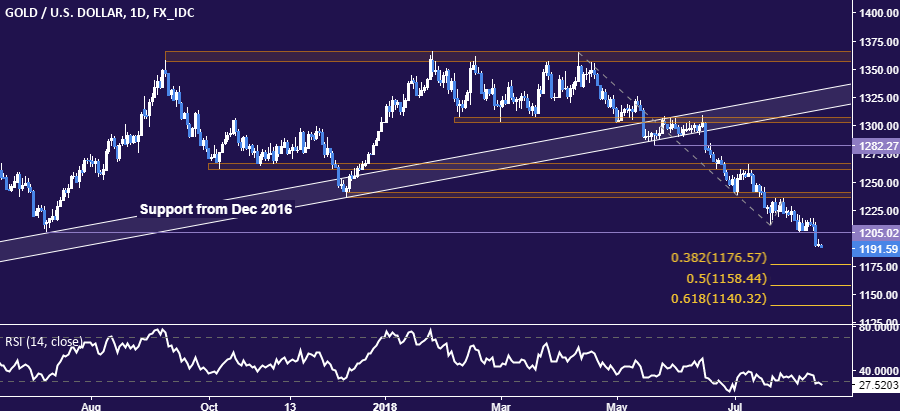
GOLD TECHNICAL ANALYSIS
Gold prices are digesting losses after suffering the largest drop in two months. From here, a daily close below the 38.2% Fibonacci expansionat 1176.57 targets the 50% level at 1158.44. Alternatively, a turn back above former support at 1205.02 paves the way for a retest of the 1236.66-40.86 area.
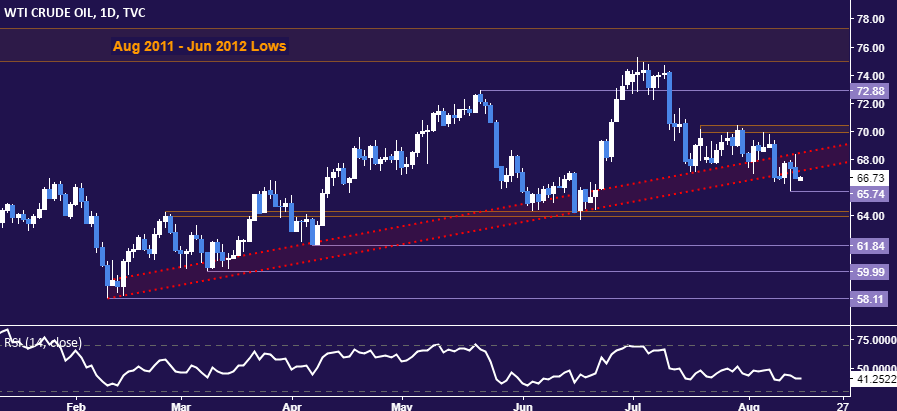
CRUDE OIL TECHNICAL ANALYSIS
Crude oil prices are still trading water near support-turned-resistance marking the uptrend from early February. A daily close above its upper layer at 68.48 exposes the 69.89-70.41 area anew. Alternatively, a break below the August 13 swing low at 65.74 targets the 63.96-64.26 zone.
COMMODITY TRADING RESOURCES
- Learn what other traders’ gold buy/sell decisions say about the price trend
- Having trouble with your strategy? Here’s the #1 mistake that traders make
- Join a Trading Q&A webinar to answer your commodity market questions
--- Written by Ilya Spivak, Currency Strategist for DailyFX.com
To contact Ilya, use the comments section below or @IlyaSpivak on Twitter


