


CRUDE OIL & GOLD TALKING POINTS:
- Crude oil prices rise as IEA hints production pickup may be over
- OPEC monthly report, EIA drilling statistics now in the spotlight
- Gold prices stuck in place as US Dollar, Treasury yields diverge
Crude oil prices turned higher Friday after the IEA upgraded demand forecasts for 2018 and 2019 while saying that supply fears have abated. This is after the OPEC-led group of top producers scaled back coordinated output cuts. Traders seemed to interpret the news to mean that pressure to step up shipments further has receded.
Meanwhile, gold prices remained stuck in place as Turkey-inspired risk aversion sent the US Dollar higher even as safety-seeking capital flows buoyed Treasury bonds, sending yields downward. That put yellow metal’s appeal as an anti-fiat alternative directly in conflict with its role as benchmark non-interest-bearing asset. This translated into sideways drift on net, highlighting the folly of categorizing gold as a “haven”.
OIL EYES OPEC REPORT & US DRILLING DATA, GOLD MAY BOUNCE
From here, the OPEC Monthly Report will help gauge if the producer bloc and its allies are indeed satisfied enough with the recent output increase to take their foot off the accelerator. Later in the day, the EIA Drilling Productivity Report will add another piece to the supply/demand puzzle, offering clues about the possibility that a pickup in shipments from the US will flood global stockpiles again.
As for gold, it edged slightly lower as sentiment soured last week. Despite prices’ inability to break loose of recent ranges, that suggests that the Dollar’s influence outpaced that of bond yields (if only slightly). This might translate into modest gains if the greenback corrects lower as risk aversion moderates after Turkey’s central bank offered markets an emergency liquidity boost.
See our guide to learn about the long-term forces driving crude oil prices !
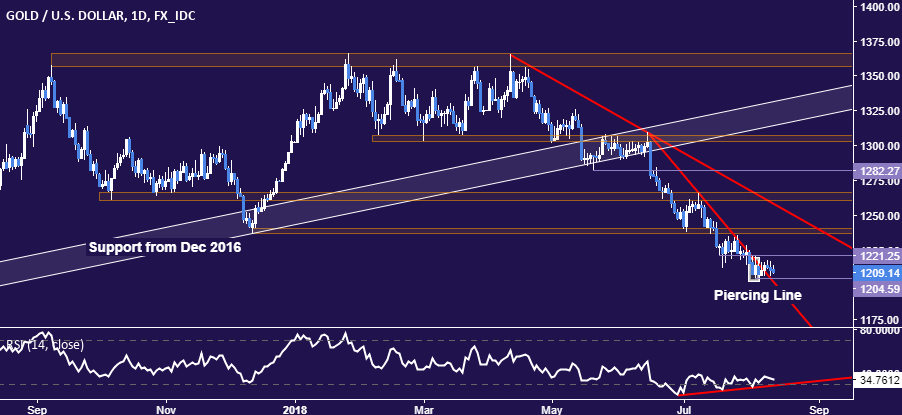
GOLD TECHNICAL ANALYSIS
Gold prices are stuck in a narrow range but a bullish Piercing Line candlestick pattern coupled with RSI divergence hints a bounce may be ahead. A push above support-turned-resistance at 1221.25 opens the door for a retest of the 1236.6-40.86 area. Immediate support is at 1204.59, the August 3 low.
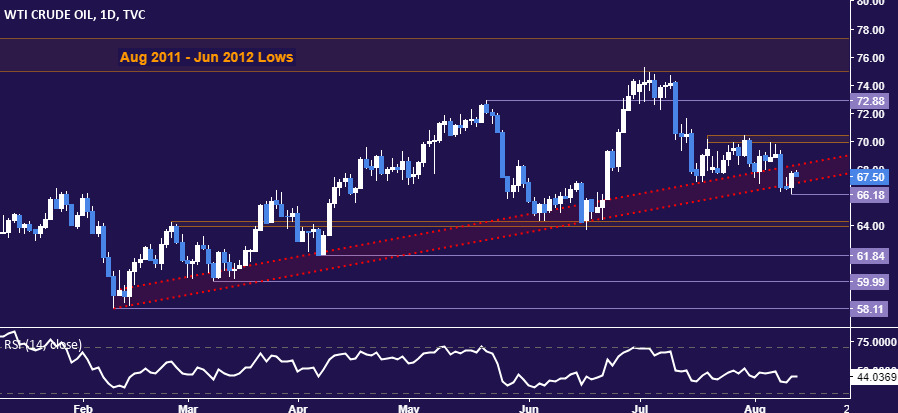
CRUDE OIL TECHNICAL ANALYSIS
Crude oil prices rose to retest support-turned-resistance marking the rising trend from early February. A daily close above its outer layer at 68.36 sees the next upside hurdle in the 69.89-70.41 area. Alternatively, a move back below the swing low at 66.18 exposes the 63.96-64.26 zone.
COMMODITY TRADING RESOURCES
- Learn what other traders’ gold buy/sell decisions say about the price trend
- Having trouble with your strategy? Here’s the #1 mistake that traders make
- Join a Trading Q&A webinar to answer your commodity market questions
--- Written by Ilya Spivak, Currency Strategist for DailyFX.com
To contact Ilya, use the comments section below or @IlyaSpivak on Twitter


