


GOLD & CRUDE OIL TALKING POINTS:
- Gold prices rise as US bond yields, Dollar fall after record debt sale
- Crude oil prices drop, talked down by officials from China and Iran
- Chart setups hint gold may be set to bounce as crude oil suffers losses
Gold prices rose yesterday as the US Dollar retreated alongside Treasury bond yields after hitting a 13-month high intraday. That helped the yellow metal leverage its appeal as an anti-fiat and non-interest bearing alternative. The move came after demand held impressively steady despite a record-setting offering of $26 billion in 10-year notes.
The bid-to-cover ratio registered at 2.55, only a hair lower than the 2.57 reading recorded at the prior sale of comparable paper. Investors seemed to interpret the outcome to mean that the oncoming flood of new issuance needed to finance the widening budget deficit will find healthy take-up. That sent US debt prices higher, trimming baseline borrowing costs.
IRAN, CHINA OFFICIALS TALK DOWN CRUDE OIL PRICES
Crude oil prices fell, suffering the largest drop in a month. The move came as Iran’s foreign minister said some European nations are lobbying for noncompliance with re-imposed US sanctions while Chinese President Xi Jinping urged state-owned energy companies to boost output. Beijing also opted to leave crude off the list of US fuel imports (such as gasoline and propane) to be hit with retaliatory tariffs.
Learn what other traders’ gold buy/sell decisions say about the price trend!
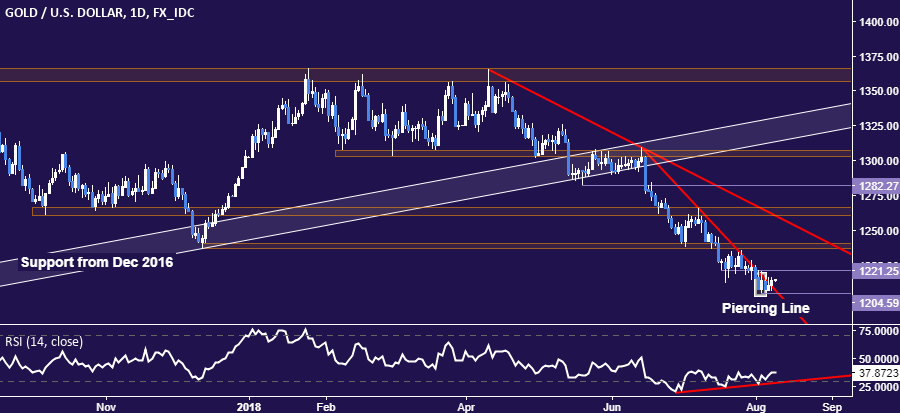
GOLD TECHNICAL ANALYSIS
Gold prices edged above trend line resistance set from mid-June, hinting an upswing may be in the works. The appearance of a bullish Morning Star candlestick pattern and positive RSI divergence reinforce the case for a rebound. A break above range floor support-turned-resistance at 1221.25 opens the door for a test of the 1236.6-40.86 area. Immediate support is at 1204.59, the August 3 low.
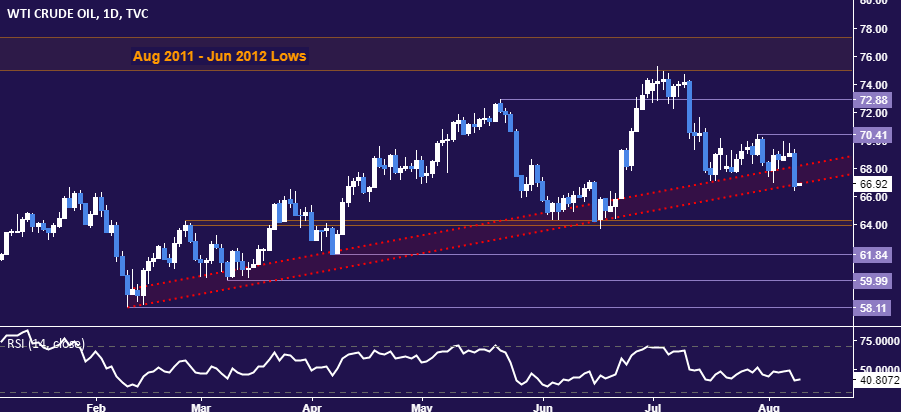
CRUDE OIL TECHNICAL ANALYSIS
Crude oil prices appear to have narrowly broken trend support set from early February, exposing the next downside barrier in the 63.96-64.26 area. A further push below that targets 61.84. Near-term resistance is at 70.41, followed by a minor level at 72.88 along the way to the 75.00-77.31 zone.
COMMODITY TRADING RESOURCES
- See our guide to learn about the long-term forces driving crude oil prices
- Having trouble with your strategy? Here’s the #1 mistake that traders make
- Join a Trading Q&A webinar to answer your commodity market questions
--- Written by Ilya Spivak, Currency Strategist for DailyFX.com
To contact Ilya, use the comments section below or @IlyaSpivak on Twitter


