


CRUDE OIL & GOLD TALKING POINTS:
- Crude oil, gold price action reflect intraday swings in the US Dollar
- EIA inventory flow data echoing API estimate may boost crude oil
- Gold eyes sentiment trends’ influence on Fed rate hike expectations
Crude oil and gold prices echoed price swings in the US Dollar yesterday. Both commodities edged up in the first half of the day as the greenback corrected lower after the prior session’s gains. That offered a de-facto lift to assets denominated in terms of the benchmark currency on global markets.
The move reversed course as the US unit recovered alongside a steepening of the futures-implied 2019 Fed rate hike path. Interestingly, that hawkish shift tracked rising US stock prices, implying that the Dollar’s widening yield advantage against its G10 counterparts is molding it into a risk-on asset.
EIA INVENTORY DATA DUE, GOLD EYEING SENTIMENT TRENDS
Looking ahead, the weekly EIA inventory flow report is in focus. It is expected to show stockpiles shed 2.16 million barrels last week. An outcome that hews closer to the 6.02 million barrel drawdown predicted in analogous API data yesterday might offer crude prices a lift.
As for gold, sentiment trends and their knock-on influence on Fed policy bets remain in focus absent top-tier scheduled event risk. A dominant directional bias is conspicuously absent however as futures tracking the FTSE 100 and S&P 500 equity benchmarks are trade flat in Asia Pacific hours.
See our guide to learn about the long-term forces driving crude oil prices !
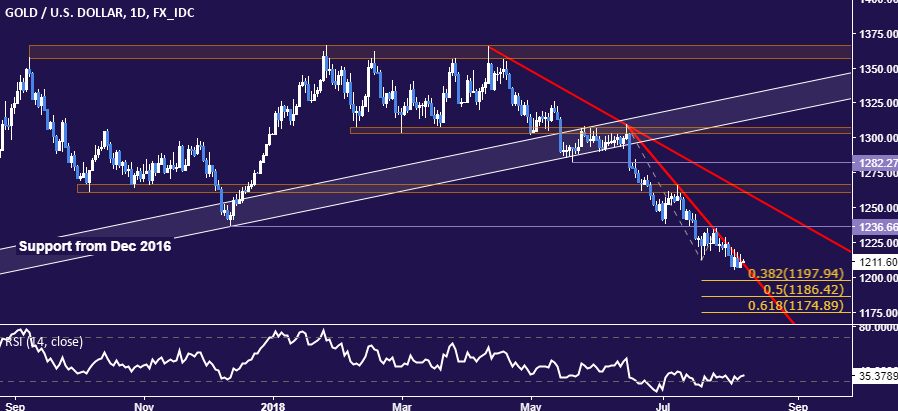
GOLD TECHNICAL ANALYSIS
Gold prices are edging downward along falling trend line resistance in play since mid-June. A push belowthe 38.2% Fibonacci expansion at 1197.94 targets the 50% level at 1186.42. Alternatively, a daily close above resistance – now at 1209.44 – paves the way for a retest of former support at 1236.66.
CRUDE OIL TECHNICAL ANALYSIS
Crude oil prices are still struggling to find direction after settling at trend support established in early February. A daily close above the 23.6% Fibonacci expansion at 70.99 exposes the 38.2% level at 73.49. Alternatively, a drop below trend support – now at 66.86 – opens the door for a test of the 63.96-64.26 area.

COMMODITY TRADING RESOURCES
- Learn what other traders’ gold buy/sell decisions say about the price trend
- Having trouble with your strategy? Here’s the #1 mistake that traders make
- Join a Trading Q&A webinar to answer your commodity market questions
--- Written by Ilya Spivak, Currency Strategist for DailyFX.com
To contact Ilya, use the comments section below or @IlyaSpivak on Twitter


