


GOLD & CRUDE OIL TALKING POINTS:
- Gold prices break July swing low, clear path below $1200/oz
- Crude oil prices bounce at chart support as risk appetite firms
- US Dollar may rise on jobs data, hurting gold prices further
Crude oil prices returned to the offensive, with the sentiment-linked WTI benchmark rising alongside the bellwether S&P 500 stock index. Technology names drove the rally, adding 1.37 percent after the market capitalization of Apple Inc surpassed $1 trillion. Meanwhile, gold prices plunged as the US Dollar accelerated upward, sapping the appeal of anti-fiat alternatives epitomized by the yellow metal.
US JOBS DATA MAY HURT GOLD PRICES FURTHER
Looking ahead, July’s US employment report is on focus. Payrolls growth is expected to come at 193k while the jobless rate ticks down to 3.9 percent and the pace of wage inflation holds steady at 2.7 percent on-year. Outcomes broadly in line with these projections would mark continuation of the business cycle status quo, which this week’s FOMC statement hinted probably means two more rate hikes before year-end.
On balance, this means anything shy of a particularly disappointing showing is likely to be supportive for the US Dollar as traders ponder the widening gap between the US central bank and its G10 counterparts. That seems likely to bode ill for gold. The implications for oil are less clear-cut as the risk-on implications of a healthy labor market compete for influence with a stronger greenback.
Learn what other traders’ gold buy/sell decisions say about the price trend!
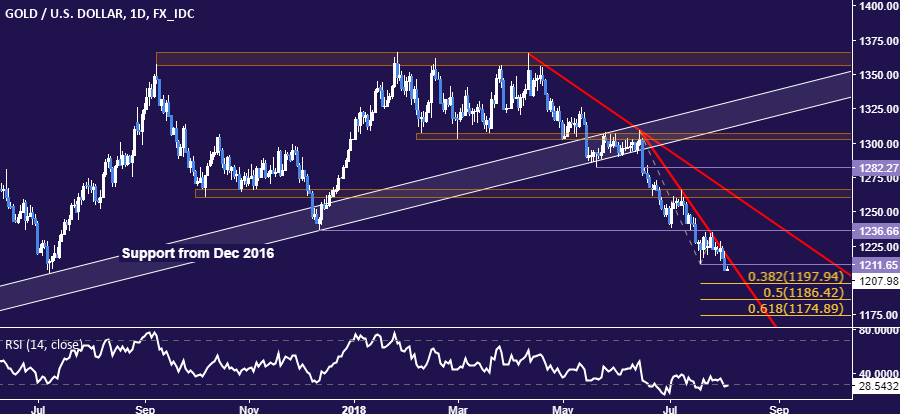
GOLD TECHNICAL ANALYSIS
Gold prices look vulnerable to deeper losses after breaking below the July 19 low at 1211.65. Sellers now aim to challenge the 38.2% Fibonacci expansion at 1197.94, with a daily close below that exposing the 50% level at 1186.42. Alternatively, a move above trend line resistance at 1217.32 targets former support at 1236.66.
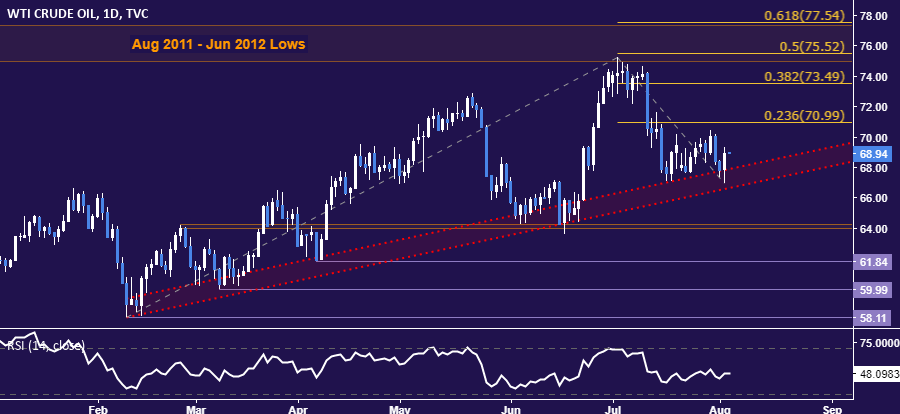
CRUDE OIL TECHNICAL ANALYSIS
Crude oil prices are attempting to launch a rebound from rising trend support set from early February. A daily close above the 23.6% Fibonacci expansion at 70.99 exposes the 38.2% level at 73.49. Alternatively, a close below trend line support at 66.68 opens the door for a test of the 63.96-64.26 area.
COMMODITY TRADING RESOURCES
- See our guide to learn about the long-term forces driving crude oil prices
- Having trouble with your strategy? Here’s the #1 mistake that traders make
- Join a Trading Q&A webinar to answer your commodity market questions
--- Written by Ilya Spivak, Currency Strategist for DailyFX.com
To contact Ilya, use the comments section below or @IlyaSpivak on Twitter


