


GOLD & CRUDE OIL TALKING POINTS:
- Gold prices locked in place as US Dollar, Treasury yields diverge
- PCE inflation data, flat risk trends unlikely to break the deadlock
- Crude oil prices may fall on EIA inventory, supply trend reports
Gold prices continued to mark time in familiar territory as a recovery in risk appetite presented the same conflicting cues that anchored the yellow metal amid risk aversion, albeit in reverse. Easing concerns about political instability in Italy saw the US Dollar give back some of its recent gains. An accompanying reversal of haven-seeking capital flows sent Treasury bonds lower and buoyed yields however. Taken together, that saw gold’s anti-fiat appeal offset by its role as the benchmark for non-interest-bearing assets.
Meanwhile, sentiment-linked crude oil prices rose, tellingly tracking the recovery in the bellwether S&P 500 stock index. API inventory flow data showing stockpiles added 1 million barrels last week seemed to be ignored. The absence of fresh news-flow building on last week’s comments from Saudi and Russian officials signaling an on-coming easing of output curbs as well as the greenback’s downturn probably helped make the case for near-term recovery as well.
PCE INFLATION, EIA INVENTORY & SUPPLY TRENDS DATA DUE
From here, the Fed’s favored PCE inflation gauge headlines the economic calendar. The core on-year inflation rate is expected to tick down to 1.8 percent in April after hitting a 14-month high at 1.9 percent in the prior month. A print broadly in the vicinity of forecasts is unlikely to meaningfully alter standing Fed policy bets and so might pass without fireworks. That coupled with consolidating risk trends might leave gold prices rudderless for now.
Meanwhile, official EIA inventory flow statistics and the agency’s monthly report on supply trends might weigh on crude oil prices. Stockpiles are expected to see a tepid inflow of 244k barrels. An outcome closer in line with the API projection may apply downside pressure. If that is coupled with signs of selling shale output in the monthly report – an outcome foreshadowed by surging rig count data – selling pressure may return in force following yesterday’s brief reprieve.
See our quarterly gold price forecast to learn what will drive the trend through mid-year!
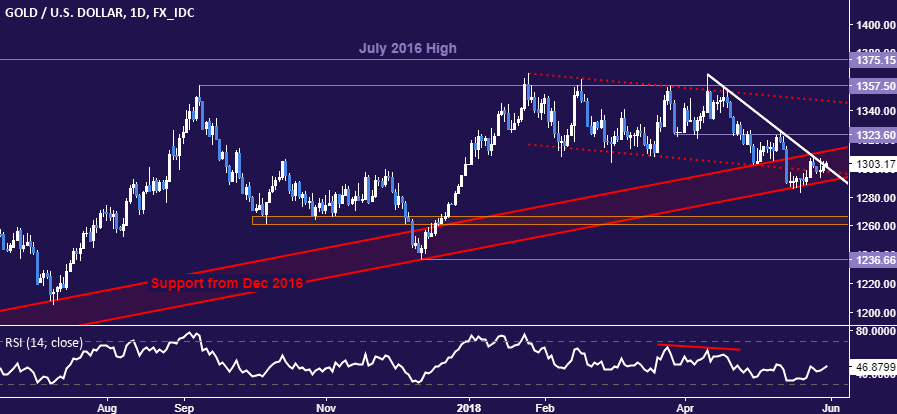
GOLD TECHNICAL ANALYSIS
Gold prices continue to be wedged between rising trend support set from December 2016 (1291.17) and a falling trend line in play since mid-April (1300.84). A breach of support initially targets the 1260.80-66.44 area. Alternatively, a daily close above resistance exposes next major hurdle at 1323.60.
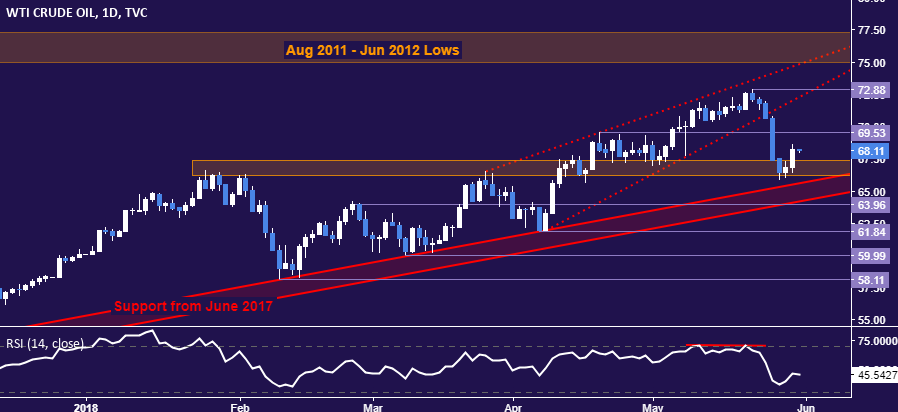
CRUDE OIL TECHNICAL ANALYSIS
Crude oil prices are attempting to mount a rebound from support in the 66.22-67.36 area. A daily close back above the April 19 high 69.53 opens the door to challenge the May 22 top at 72.88. Alternatively, a push through immediate support as well as the rising trend boundary at 63.96 paves the way for a test of 61.84.
COMMODITY TRADING RESOURCES
- Learn what other traders’ gold buy/sell decisions say about the price trend
- Having trouble with your strategy? Here’s the #1 mistake that traders make
- Join a Trading Q&A webinar to answer your commodity market questions
--- Written by Ilya Spivak, Currency Strategist for DailyFX.com
To contact Ilya, use the comments section below or @IlyaSpivak on Twitter


