


CRUDE OIL & GOLD TALKING POINTS:
- Crude oil prices sink as Saudi Arabia joins Russia call for output boost
- Gold prices face selling pressure in risk-on and -off market conditions
- Ebbing Italy worries boost sentiment but follow-through may be absent
Crude oil prices plunged on Friday as Saudi energy minister Khalid al-Falih endorsed prior comments from his Russian counterparts calling for self-imposed output curbs to be relaxed, perhaps as soon as June. Gold prices edged lower as oil’s plunge pulled down energy-linked stocks, contributing to broader risk aversion that fed haven demand for the US Dollar.
The oil selloff continues early Monday as Asia Pacific traders take their turn to price in Friday’s news. Meanwhile, gold faces renewed selling pressure as risk appetite improves, boosting bond yields and sapping the appeal of non-interest-bearing assets. Investors’ chipper mood follows news that Italian President Sergio Mattarella vetoed the nomination of eurosceptic Paolo Savona to the post of Economy Minister.
ITALY REMAINS IN FOCUS, US MARKETS SHUTTERED
Looking ahead, a thin offering on the economic calendar hints that established momentum ought to find few roadblocks to near-term continuation. The closure of US markets for the Memorial Day holiday is likely to sap liquidity and may undermine scope for follow-through however. Furthermore, the highly fluid situation in Italy may yet amount to headline flow that pushes sentiment back into “risk-off” mode.
See our quarterly crude oil price forecast to learn what will drive the trend through mid-year!
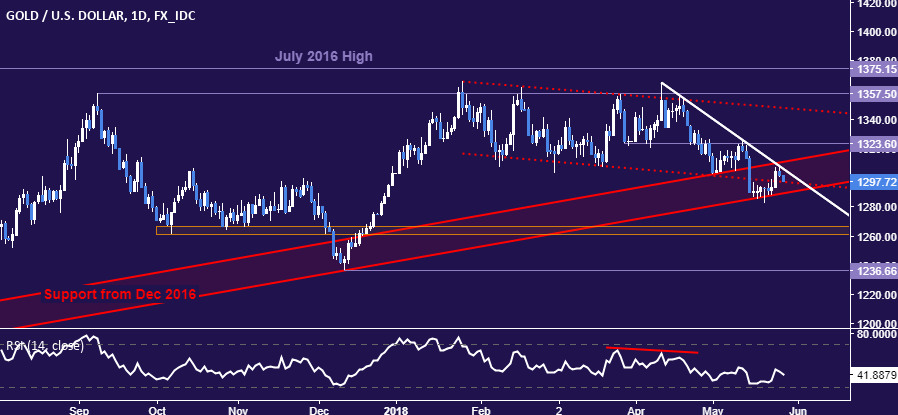
GOLD TECHNICAL ANALYSIS
Gold prices are pulling back from falling trend line resistance guiding the move lower since mid-April. From here, a daily close below the outer layer of trend support set from December 2016, now at 1289.69, exposes the 1260.80-66.44 area next. Alternatively, a break above 1310.70 – the upper layer of uptrend support, aims for a retest of the chart inflection point at 1323.60.
CRUDE OIL TECHNICAL ANALYSIS
Crude oil prices accelerated lower after establishing a top below the $73/bbl figure, as expected. Sellers are now testing congestion area support in the 66.22-67.36 zone, with a break below that targeting a rising trend line 65.28. The first layer of major resistance is at 69.53, the April 19 high. That is broadly followed by the May 22 top at 72.88.

COMMODITY TRADING RESOURCES
- Learn what other traders’ gold buy/sell decisions say about the price trend
- Having trouble with your strategy? Here’s the #1 mistake that traders make
- Join a Trading Q&A webinar to answer your commodity market questions
--- Written by Ilya Spivak, Currency Strategist for DailyFX.com
To contact Ilya, use the comments section below or @IlyaSpivak on Twitter


