


CRUDE OIL & GOLD TALKING POINTS:
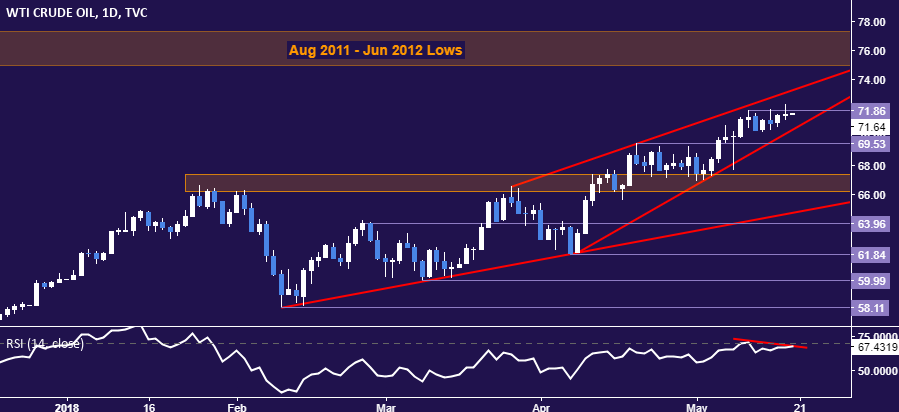
- Crude oil price continue to show signs of topping below $72/bbl
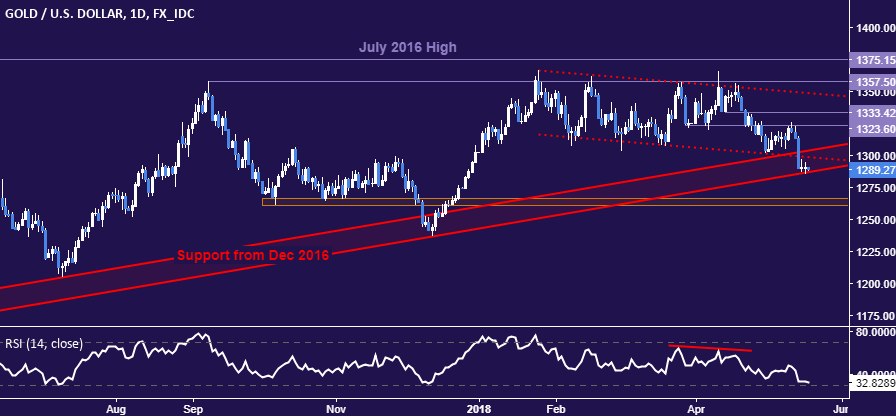
- Gold prices desperately clinging to support from December 2016
- Lull in top-tier event risk might translate into kneejerk volatility
Commodity prices languished in digestion mode yesterday, as expected. Crude oil and gold prices swung between gains and losses as the absence of an obvious directional catalyst translated into directionless drift. They have been trading as a foil to Fed-driven US Dollar gains. Without fresh fodder feeding that narrative one way or another, they were left them rudderless.
EVENT RISK LULL MAY BOOST KNEEJERK VOLATILITY
Looking ahead, another quiet day on the economic calendar might make for continued consolidation into the end of the trading week. Market participants hungry for a catalyst may pounce on stray headline flow more readily however, which might translate into kneejerk volatility. Traders would be wise not to over-interpret such moves and assume their magnitude necessarily implies follow-through however.
See our quarterly crude oil price forecast to learn what will drive the trend through mid-year!
GOLD TECHNICAL ANALYSIS
Gold prices are digesting losses having dropped to the outer layer of support establishing the uptrend from December 2016, now at 1286.55. A daily close below that exposes the 1260.80-66.44 area. Alternatively, a push back above 1304.73 targets falling trend line resistance at 1316.69.
CRUDE OIL TECHNICAL ANALYSIS
Signs of topping continue to mark crude oil price action, from negative RSI divergence t the formation of a rising Wedge chart pattern. A break below resistance-turned-support at 69.53 opens the door for another test of the 66.22-67.36 area. Alternatively, a breach above the May 10 high at 71.86 confirmed on a daily closing basis exposes wedge top resistance at 73.24.
COMMODITY TRADING RESOURCES
- See our guide to learn about the long-term forces driving crude oil prices
- Having trouble with your strategy? Here’s the #1 mistake that traders make
- Join a Trading Q&A webinar to answer your commodity market questions
--- Written by Ilya Spivak, Currency Strategist for DailyFX.com
To contact Ilya, use the comments section below or @IlyaSpivak on Twitter


