


CRUDE OIL & GOLD TALKING POINTS:
- Crude oil price chart continues to warn of an emerging top
- Monthly IEA report, EIA inventory data may inspire selling
- Gold prices testing critical support after Fed-linked decline
A sharp US Dollar rally weighed on crude oil and gold prices alike. Swelling Fed rate hike bets drove the currency higher alongside front-end bond yields. The spread between rates on two- and ten-year Treasury bond rates tellingly steepened and the 2019 policy path implied in Fed Funds futures reflected a hawkish shift in the markets’ expectations.
The WTI benchmark succumbed to de-facto selling pressure since prices are denominated in USD terms on global markets, but managed to claw back most of the loss to finish the day little-changed. The yellow metal was not so lucky, suffering the largest daily drop in ten months as demand for anti-fiat and non-interest-bearing assets evaporated.
IEA REPORT, EIA INVENTORY DATA, FED-SPEAK
From here, a lull in top tier US news flow might allow for a bit of consolidation in Fed-linked volatility. Scheduled comments from Raphael Bostic and James Bullard – presidents of the US central bank’s Atlanta and St Louis branches, respectively – seem unlikely to be groundbreaking enough to stoke lasting volatility. That might allow gold a bit of a corrective bounce as yesterday’s losses are digested.
Meanwhile, crude oil will turn its attention to a monthly report from the IEA as well as EIA weekly inventory flow data. The former will inform global supply and demand expectations and may help establish the extent to which the re-imposition of sanctions on Iran is likely to be price-supportive. The latter is expected to show stockpiles shed 1.35 million barrels last week.
Yesterday, API reported that US storage swelled by 4.85 million barrels. If that proves to foreshadow disappointment when official statistics cross the wires, prices may be sent downward. An IEA report that underscores the capacity for swelling US output to offset drop in availability of Iranian crude on global markets might also help drive downside momentum.
See our quarterly crude oil price forecast to learn what will drive the trend through mid-year!
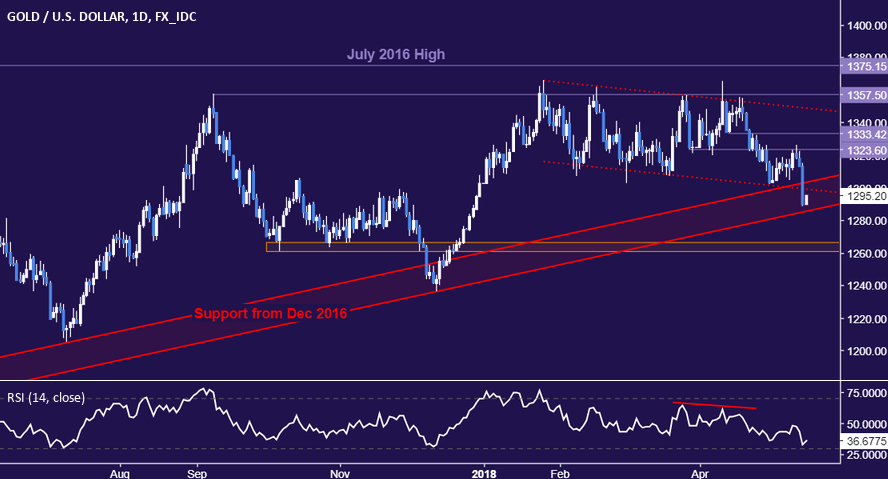
GOLD TECHNICAL ANALYSIS
Gold prices plunged to test support guiding the uptrend from December 2016. A daily close below its lower boundary, now at 1286.22, exposes the 1260.80-66.44 area. Alternatively, a move above 1304.00 would pave the way for another challenge of support-turned-resistance in the 1323.60-33.42 zone.
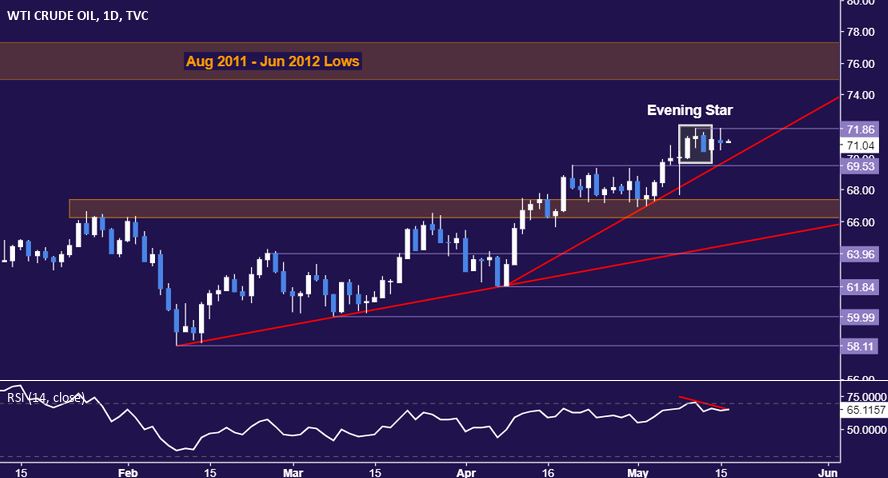
CRUDE OIL TECHNICAL ANALYSIS
The appearance of a bearish Evening Star candlestick pattern coupled with negative RSI divergence hints crude oil prices may be topping. A daily close below 69.53 (trend line, former range top) opens the door for a test of resistance-turned-support in the 66.22-67.36 area. Alternatively, a break above the May 10 high at 71.86 exposes the 75.00-77.31 region (August 2011, June 2012 swing lows).
COMMODITY TRADING RESOURCES
- Learn what other traders’ gold trade decisions say about the price trend
- Having trouble with your strategy? Here’s the #1 mistake that traders make
- Join a Trading Q&A webinar to answer your commodity market questions
--- Written by Ilya Spivak, Currency Strategist for DailyFX.com
To contact Ilya, use the comments section below or @IlyaSpivak on Twitter


