


CRUDE OIL & GOLD TALKING POINTS:
- Crude oil price chart shows topping setup below key resistance
- OPEC and EIA reports to help inform supply trend expectations
- Gold prices negotiating uptrend support from December 2016
Commodity prices fell on Friday, with crude oil and gold prices down in tandem as bets on rising lending rates undercut the appeal of non-interest-bearing and anti-fiat alternatives. The spread between two- and ten-year US Treasury bond yields widened as borrowing costs at the longer end edged up.
OPEC, EIA TO INFORM CRUDE OIL SUPPLY OUTLOOK
From here, the OPEC monthly report as well as EIA drilling productivity statistics are in focus. The former will help illustrate the extent to which new sanctions on Iran might impact global supply flow. Saudi Arabia has pledged to keep prices stable even if the cartel’s third-largest producer is sidelined. Meanwhile, the EIA will help gauge how much swing output might be coming to market in the near term.
See our quarterly crude oil price forecast to learn what will drive the trend through mid-year!
GOLD TECHNICAL ANALYSIS
Gold prices continue to hover above rising trend support set from December 2016, now in the 1284.71-1302.73 area. A break below that would mark a major shift in the dominant trajectory and initially expose the next layer of support in the 1260.80-66.44 region. Alternatively, a rebound though minor upside barriers in the 1323.60-33.42 zone opens the way for a retest of resistance defining the bearish bias since the beginning of the year. This is marked by a channel ceiling and a double top in the 1349.68-57.50 area.

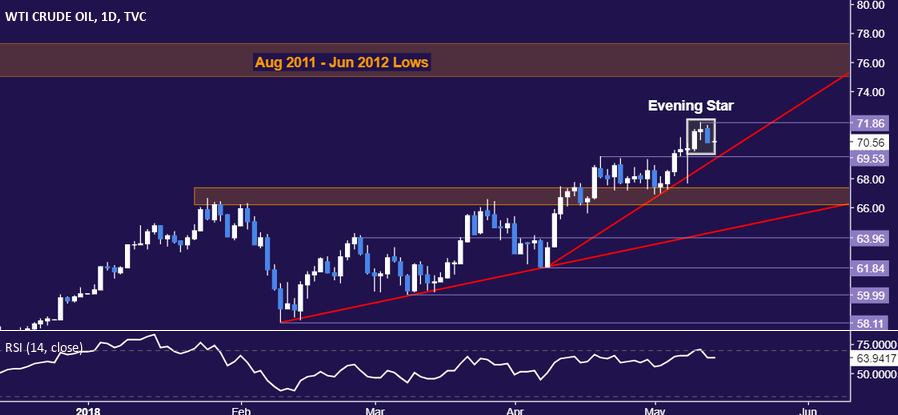
CRUDE OIL TECHNICAL ANALYSIS
Crude oil prices put in a bearish Evening Star candlestick pattern, hinting a move lower may be in the works. A break below support at 69.53 (trend line, former range top) opens the door for a retest of resistance-turned-support in the 66.22-67.36 congestion area. Alternatively, a daily close above the May 10 high at 71.86 would invalidate topping cues and expose the 75.00-77.31 zone, marked by swing bottoms set in August 2011 and June 2012 (now recast as resistance).
COMMODITY TRADING RESOURCES
- See our guide to learn about the long-term forces driving crude oil prices
- Having trouble with your strategy? Here’s the #1 mistake that traders make
- Join a Trading Q&A webinar to answer your commodity market questions
--- Written by Ilya Spivak, Currency Strategist for DailyFX.com
To contact Ilya, use the comments section below or @IlyaSpivak on Twitter


