CRUDE OIL & GOLD TALKING POINTS:
- Crude oil price rise amid broad improvement in risk appetite
- Gold prices in digestion mode, mirroring US Dollar standstill
- Firm US CPI may boost Fed rate hike bets, hurt commodities
Cycle-sensitive crude oil prices pushed upward amid a broad-based improvement in risk appetite. Indeed, the WTI contract tracked upward alongside the bellwether S&P 500 stock index. Gold prices marked time. The benchmark anti-fiat asset mirrored standstill in the US Dollar, where a lull in a lull in top-tier event risk translated into a consolidative period (as expected).
COMMODITIES MAY FALL ON US CPI DATA
Looking ahead, April’s US CPI report is in focus. The headline inflation rate is expected to rise to 2.5 percent on-year while the core reading stripping out volatile food and energy costs is seen printing at 2.2 percent. Both would mark the highest outcomes in 14 months. An upside surprise echoing clues in recent PMI survey data may reinvigorate Fed rate hike speculation, boosting the greenback at the expense of raw materials prices.
See our quarterly crude oil price forecast to learn what will drive the trend through mid-year!
GOLD TECHNICAL ANALYSIS
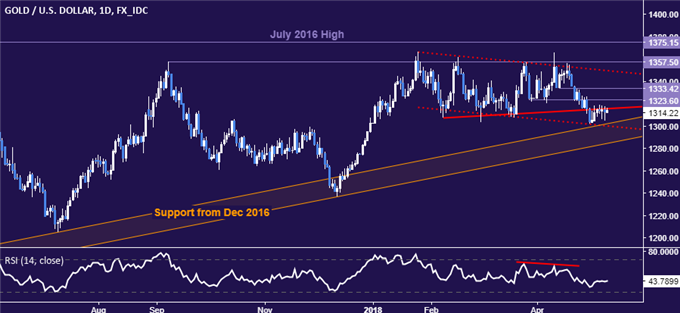
Gold prices are stalling above rising trend support set from December 2016, now in the 1284.30-1301.92 area, with a daily close below that marking a major shift in the dominant long-term trajectory. Alternatively, a breach of former trend line support at 1315.44 paves the way for another challenge of 1323.60.

CRUDE OIL TECHNICAL ANALYSIS
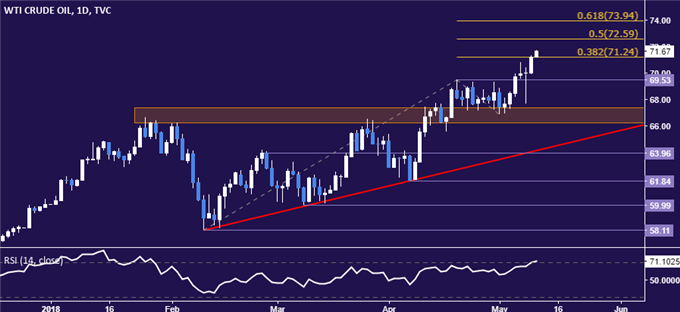
Crude oil prices are testing above the 38.2% Fibonacci expansionat 71.24, with confirmation of a break on a daily closing basis exposing the 50% level at 72.59. Alternatively, a turn back below the April 19 high at 69.53 targets resistance-turned-support in the 66.22-67.36 area.

COMMODITY TRADING RESOURCES
- Learn what other traders’ gold buy and sell bets say about the price trend
- Having trouble with your strategy? Here’s the #1 mistake that traders make
- Join a Trading Q&A webinar to answer your commodity market questions
--- Written by Ilya Spivak, Currency Strategist for DailyFX.com
To contact Ilya, use the comments section below or @IlyaSpivak on Twitter
To receive Ilya's analysis directly via email, please SIGN UP HERE


