


CRUDE OIL & GOLD TALKING POINTS:
- Commodity prices fell in pre-positioning for the FOMC rate decision
- Crude oil price range holds but gold seems to have broken downward
- Markets may be primed for a more hawkish Fed tone than is realistic
Worries about an accelerated pace of Fed interest rate hikes seemed to define price action benchmark commodities. Crude oil and gold prices tracked lower alongside bellwether S&P 500 futures while the US Dollar rallied and the priced-in 2018 rate hike path implied in Fed Funds futures steepened.
The cycle-sensitive WTI contract faced dual headwinds, with fears that aggressive tightening will go too far in cooling economic activity compounded by de-facto selling pressure since prices are denominated in USD terms on global markets. The yellow metal suffered amid the ebbing appeal of anti-fiat alternatives.
FED RATE DECISION CRITICAL, EIA INVENTORY DATA DUE
Needless to say, all eyes now turn to the FOMC policy announcement, where traders will look for official rhetoric to ratify the hawkish shift in baseline forecasts over the past two weeks. If Chair Powell and company deliver accordingly, commodities are set to suffer further.
Two weeks of aggressive repositioning might have markets primed for a more assertive stance than policymakers are prepared to hazard. That may translate into a bit of disappointed divestment from the “hawkish Fed” narrative, which might allow commodities a bit of a recovery in the near term.
Elsewhere on the docket, EIA inventory data is expected to show a meager inflow of 840.5k barrels last week. An API estimate published yesterday begs to differ, calling for a gain of 3.43 million barrels. If official statistics hew closer to that reading, oil prices may prove to be especially vulnerable.
See our quarterly crude oil price forecast to learn what will drive the trend through mid-year!
GOLD TECHNICAL ANALYSIS
Gold prices punctured critical support in the 1307.63-08.65 area (3-month range floor, 23.6% Fibonacci expansion), opening the door for a test of a rising trend line set form December 2016. A daily close below that and the 38.2% level at 1273.14 would mark a major bearish reversal. Alternatively, a reversal back above 1308.68 has scope for a retest of Triangle bottom support-turned-resistance at 1316.42, followed by a former inflection point at 1323.60.

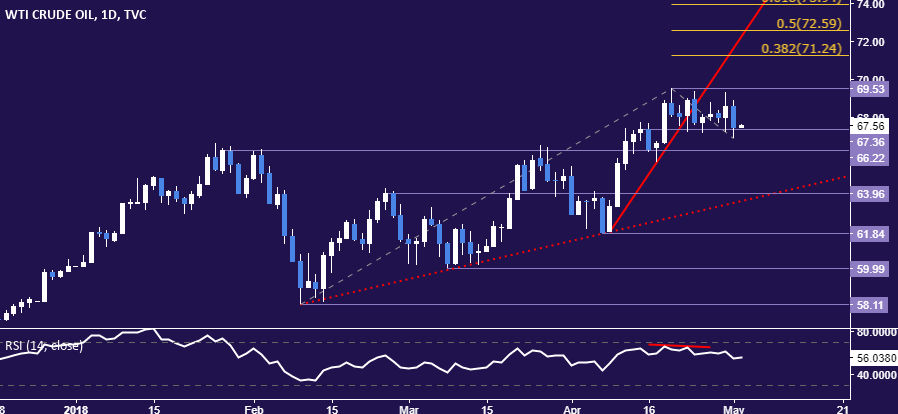
CRUDE OIL TECHNICAL ANALYSIS
Crude oil prices continue to tread water in a narrow range below the $70/bbl figure. A break below its floor at 67.36 initially targets resistance-turned-support at 66.22. Alternatively, move above the April 19 highat 69.53 exposes the 38.2% Fibonacci expansion at 71.24.
COMMODITY TRADING RESOURCES
- Learn what retail traders’ gold buy and sell bets say about the price trend
- Having trouble with your strategy? Here’s the #1 mistake that traders make
- Join a Trading Q&A webinar to answer your commodity market questions
--- Written by Ilya Spivak, Currency Strategist for DailyFX.com
To contact Ilya, use the comments section below or @IlyaSpivak on Twitter
To receive Ilya's analysis directly via email, please SIGN UP HERE


