


CRUDE OIL & GOLD TALKING POINTS:
- Crude oil prices range-bound, EIA supply report on tap
- Gold prices manage shallow bounce from one-month low
- PCE data may boost US Dollar, pressuring commodities
Crude oil prices marked time Friday absent top-tier news flow to inspire volatility. Gold prices retraced upward in what looked like a correction after swelling Fed rate hike speculation sent the US Dollar higher and sent the yellow metal to a one-month low.
PCE INFLATION, EIA SUPPLY DATA ON TAP
Looking ahead, monthly petroleum supply data from the EIA may help inform speculation about whether rebuilding US output can derail OPEC-led supply cut efforts. Meanwhile, the Fed’s favored PCE inflation gauge is expected to put core price growth at a 13-month high of 1.9 percent.
The latter would put the Fed within a hair of at least nominally meeting its dual objectives. Policymakers aim for inflation of 2 percent to be sustained in the medium term – diminishing the significance of a single month’s reading – but another sign of steady progress may reinforce the case for tightening.
Gold may return to the defensive if this materializes as the prospect of higher rates buoys the US Dollar, undercutting demand for non-interest-bearing and anti-fiat assets. Oil may also feel a degree of de-facto pressure because prices are denominated in USD terms on global markets.
See our quarterly crude oil price forecast to learn what will drive the trend through mid-year!
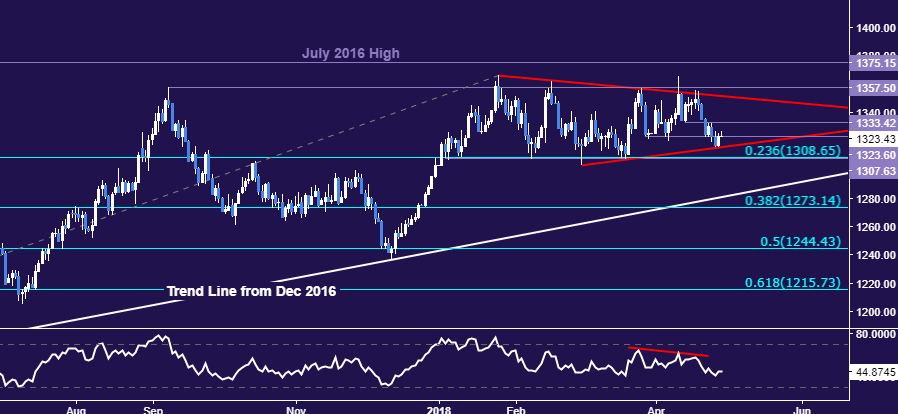
GOLD TECHNICAL ANALYSIS
Gold prices paused at Triangle support, now at 1316.00. A break below that opening the door for a test of the 1307.63-08.65 area (range floor, 23.6% Fibonacci expansion). Alternatively, a move back above support-turned-resistance at 1323.60 sees the next near-term upside barrier at 1333.42.
CRUDE OIL TECHNICAL ANALYSIS
Crude oil prices are treading water below $70/bbl figure. A move under the range floor at 67.36 exposes resistance-turned-support at 66.22. Last week’s break of rising trend line support makes for a cautiously bearish bias, with a close above the April 19 high at 69.53 needed for invalidation.

COMMODITY TRADING RESOURCES
- See our guide to learn about the long-term forces driving crude oil prices
- Having trouble with your strategy? Here’s the #1 mistake that traders make
- Join a Trading Q&A webinar to answer your commodity market questions
--- Written by Ilya Spivak, Currency Strategist for DailyFX.com
To contact Ilya, use the comments section below or @IlyaSpivak on Twitter
To receive Ilya's analysis directly via email, please SIGN UP HERE


