


Talking Points:
- Crude oil, gold prices mark time as liquidity ebbs into holiday lull
- Technical positioning hints at weakness when participation returns
- Weekend news-flow, US data anticipation may translate into gaps
Commodity prices marked time as investors settled in for market closures in observance of the Good Friday holiday. Australia, Hong Kong and most of Europe’s largest exchanges remain closed through Monday, making for thin liquidity.
While that might delay any significant trend development until Tuesday, traders would be wise to keep an eye on weekend news-flow for the possibility of gapping when participation levels begin to rebuild. Pre-positioning for top tier US data including ISM and payrolls releases may also front-load volatility.
See our free guide to learn what are the long-term forces driving crude oil prices !
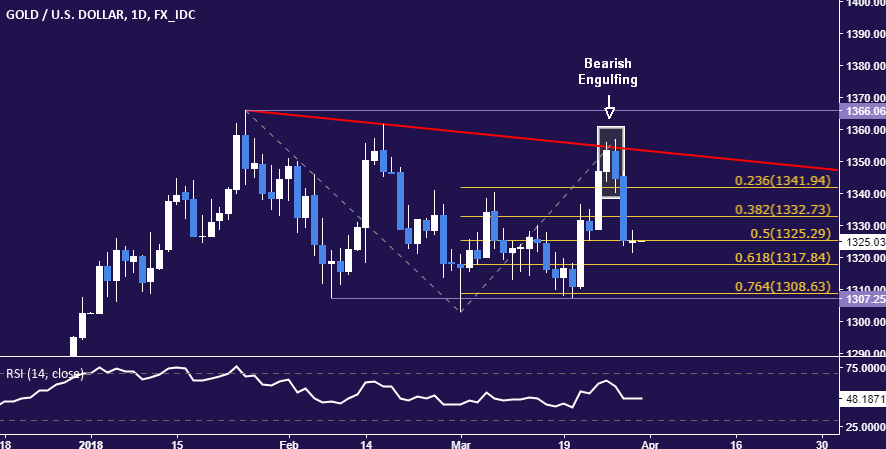
GOLD TECHNICAL ANALYSIS
Gold prices paused to digest losses having dropped after producing a Bearish Engulfing candlestick pattern, as expected. A daily close below the 50% Fibonacci expansion at 1325.29 sees the next downside barrier at 1317.84, the 61.8% level. Alternatively, a turn back above the 38.2% Fib at 1332.73 exposes the 23.6% expansion at 1341.94 anew.
CRUDE OIL TECHNICAL ANALYSIS
Crude oil prices are stalling at chart support but a bearish Evening Star candlestick pattern continues to hit a double top is in place. Breaching the 23.6%Fibonacci expansion at 63.90 on a daily closing basis exposes channel floor support at 61.23. Alternatively, turn above resistance in the 66.63-67.49 area (January 25 high, 38.2% level) targets the 50% Fib at 70.38.

COMMODITY TRADING RESOURCES
- Learn what retail traders’ gold buy and sell bets say about the price trend
- Having trouble with your strategy? Here’s the #1 mistake that traders make
- Join a Trading Q&A webinar to answer your commodity market questions
--- Written by Ilya Spivak, Currency Strategist for DailyFX.com
To contact Ilya, use the comments section below or @IlyaSpivak on Twitter
To receive Ilya's analysis directly via email, please SIGN UP HERE


