


Talking Points:
- Gold prices fall as 4Q US GDP revision drives Dollar higher
- EIA data compounds USD-linked pressure on crude oil prices
- PCE report may help realize bearish technical positioning
Gold prices fell as the US Dollar pushed higher for a second day, undercutting demand for anti-fiat alternatives. The greenback rose with front-end Treasury bond yields while the rate hike trajectory priced into Fed Funds futures steepened as revised fourth-quarter US GDPdatawas upgraded to put the annualized economic growth rate at 2.9 percent. That topped the prior estimate of 2.5 percent and the smaller adjustment to 2.7 percent expected by economists.
The benchmark currency’s ascent also weighed on crude oilprices, which suffered de-facto pressure since prices are denominated in USD terms on global markets. That was compounded by EIA inventory flow data showing stockpiles added 1.6 million barrels last week, topping forecasts calling for a meager 146.4k inflow. Still, the gain fell short of the blockbuster inflow of 5.32 million barrels predicted by API yesterday.
Looking ahead, the Fed’s favored PCE inflation gauge is in focus. The core price growth rate is expected to rise to 1.6 percent on-year, the highest in 11 months. Broadly speaking, US data outcomes have cautiously improved relative baseline forecasts over the past month. An upside surprise echoing this pattern may stoke bets on an accelerated Fed tightening path, offering the US Dollar another upward push at the expense of gold and crude oil alike.
Learn what retail traders’ gold buy and sell decisions say about the price trend!
GOLD TECHNICAL ANALYSIS
Gold prices fell after forming a Bearish Engulfing candlestick pattern, as expected. From here, a daily close below the 50% Fibonacci expansion at 1325.29 exposes the 61.8% level at 1317.84. Alternatively, a move back above the 38.2% Fib at 1332.73 paves the way for a retest of the 23.6% expansion at 1341.94.

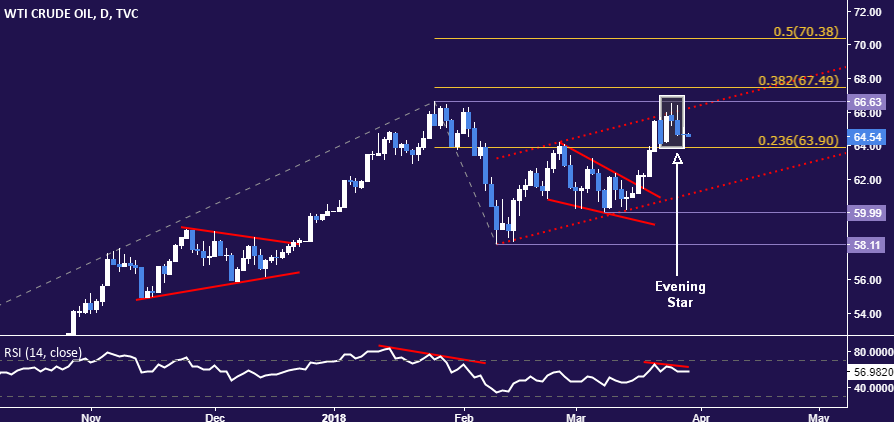
CRUDE OIL TECHNICAL ANALYSIS
The formation of a bearish Evening Star candlestick pattern continues to warn that crude oil prices have produced a double top. Near-term support is marked by the 23.6%Fibonacci expansion at 63.90, with daily close below that targeting a rising channel floor at 61.14. Alternatively, push above resistance in the 66.63-67.49 area (January 25 high, 38.2% level) opens the door for a test of the 50% Fib at 70.38.
COMMODITY TRADING RESOURCES
- See our guide to learn about the long-term forces driving crude oil prices
- Having trouble with your strategy? Here’s the #1 mistake that traders make
- Join a Trading Q&A webinar to answer your commodity market questions
--- Written by Ilya Spivak, Currency Strategist for DailyFX.com
To contact Ilya, use the comments section below or @IlyaSpivak on Twitter
To receive Ilya's analysis directly via email, please SIGN UP HERE


