


Talking Points:
- Crude oil prices shrug off risk aversion, Saudi export surge
- API inventory flow data may revive volatility, build expected
- Gold prices mark time ahead of the FOMC policy decision
Crude oil prices marked time following Friday’s somewhat mysterious upward push. Aggressive risk aversion and JODI data showing Saudi exports rose to 7.17 million barrels per day in January – the highest since March 2017 – failed to make a lasting mark on price action.
Activity may return API inventory flow data crosses the wires. It will be judged against forecasts envisioning a build of 2.34 million barrels to be reported in official EIA statistics due Wednesday. A larger inflow may hurt the WTI benchmark while a smaller one could send it upward.
Gold prices recovered from the previous day’s losses but otherwise failed to make significant headway. The absence of directional conviction may reflect traders’ apprehension ahead of the upcoming FOMC monetary policy announcement, which may mark acceleration of the Fed rate hike cycle.
See our free guide to learn what are the long-term forces driving crude oil prices !
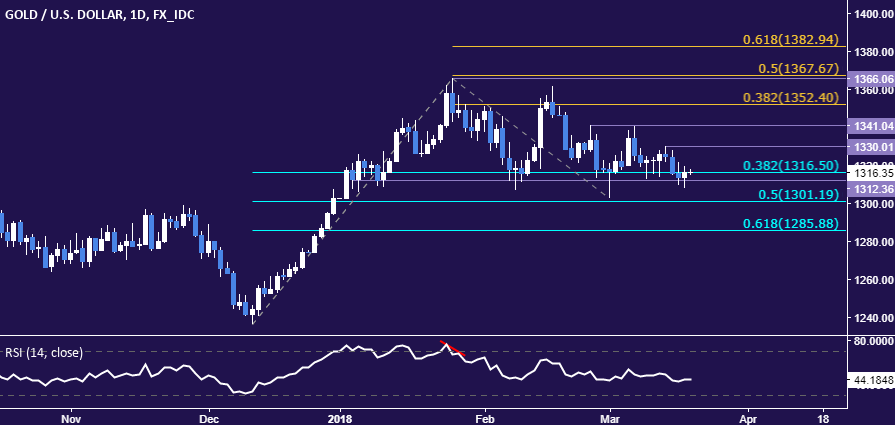
GOLD TECHNICAL ANALYSIS
Gold prices remain stubbornly stuck at support in the 1312.36-16.50 area (range floor, 38.2% Fib retracement). Breaking it on a daily closing basis initially exposes the 50% levelat 1301.19. Alternatively, push upward that breaches the March 14 swing high at 1330.01 opens the door for a test of the recent range top at 1341.04.
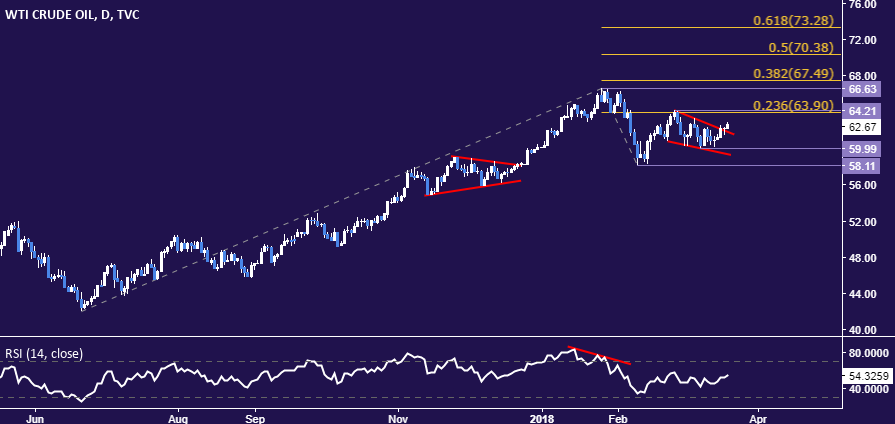
CRUDE OIL TECHNICAL ANALYSIS
Crude oil prices paused to digest after breaking upward from a Falling Wedge chart pattern. From here, a daily close above resistance in the 63.90-64.21 area (23.6% Fibonacci expansion, February 26 high) paves the way to a challenge of the 66.63-67.49 zone (January 25 high, 38.2% level). Alternatively, a drop back through the wedge top targets the $60/bbl figure.
COMMODITY TRADING RESOURCES
- Learn what retail traders’ gold buy and sell bets say about the price trend
- Having trouble with your strategy? Here’s the #1 mistake that traders make
- Join a Trading Q&A webinar to answer your commodity market questions
--- Written by Ilya Spivak, Currency Strategist for DailyFX.com
To contact Ilya, use the comments section below or @IlyaSpivak on Twitter
To receive Ilya's analysis directly via email, please SIGN UP HERE


