Talking Points:
- Commodity prices fall as dovish ECB stokes broad US Dollar rally
- US jobs data may boost Fed rate hike bets, triggering further losses
- Gold prices stuck at range support, crude oil prices at 1-month low
Commodity prices fell as the ECB-inspired EUR/USD drop echoed as broad-based US Dollar strength around the financial markets. The cross accounts for nearly a quarter of all FX market turnover, so it makes sense that the greenback’s performance there would have knock-on effects on its value overall. That hurt assets denominated in USD terms on global markets, including gold and crude oil.
The single currency whipsawed as the central bank delivered a much-anticipated monetary policy announcement but ultimately found its way lower, as expected. President Mario Draghi said QE will continue until officials see a “sustained adjustment” in the inflation path, adding that underlying price pressures are “subdued”. Tellingly, official inflation forecasts for next year were lowered.
From here, all eyes are on February’s US jobs report. Survey data hints that wage inflation is likely to remain elevated, stoking Fed rate hike speculation and giving the Dollar a further lift. That may translate into de-facto pressure on the WTI benchmark once again. Gold might face outsized losses however as its anti-fiat and alternative store-of-value credentials turn into liabilities.
Learn what retail traders’ gold buy and sell bets say about the price trend!
GOLD TECHNICAL ANALYSIS
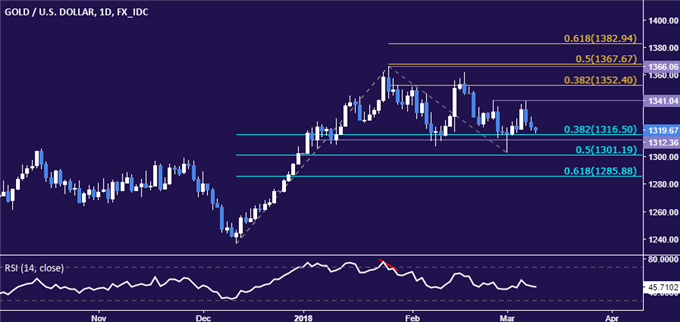
Gold prices continue to mark time at familiar support in the 1312.36-16.50 area (range floor, 38.2% Fib retracement). Breaking this barrier on a daily closing basis sees the next downside threshold at 1301.19, the 50% level. Alternatively, a push above range resistance at 1341.04 exposes the 38.2% Fib expansion at 1352.40.

CRUDE OIL TECHNICAL ANALYSIS
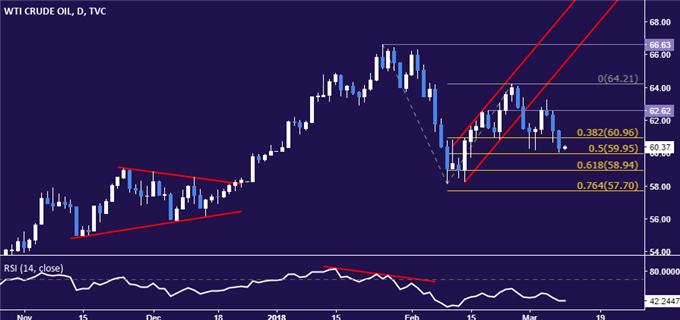
Crude oil prices dropped to the lowest level in nearly a month, challenging the 50% Fibonacci expansion at 59.95. A daily close below this barrier exposes the 61.8% level at 58.94. Alternatively, a reversal back above the 38.2% Fibat 60.96 opens the door for another test of chart inflection point resistance at 62.62.

COMMODITY TRADING RESOURCES
- See our guide to learn about the long-term forces driving crude oil prices
- Having trouble with your strategy? Here’s the #1 mistake that traders make
- Join a Trading Q&A webinar to answer your commodity market questions
--- Written by Ilya Spivak, Currency Strategist for DailyFX.com
To contact Ilya, use the comments section below or @IlyaSpivak on Twitter
To receive Ilya's analysis directly via email, please SIGN UP HERE


