Talking Points:
- Gold prices may fall as strong US inflation data boosts the US Dollar
- Crude oil prices vulnerable on EIA inventory data, risk aversion threat
- See here what retail traders' gold bets say about coming price moves
Gold prices rose as the US Dollar continued to correct lower having hit a one-month high on Friday. The greenback’s weakness may reflect protective pre-positioning ahead of the upcoming release of US CPI data. That is expected to show price growth slowed in January.
The possibility of an upside surprise echoing a surge in wage inflation over the same period seems significant however. Such an outcome may rekindle fears of an aggressive Fed rate hike cycle, pushing the US currency higher anew and pushing the yellow metal downward.
Crude oil prices edged slightly lower. The IEA warned that growing US output can derail OPEC-led efforts to wind down a global supply glut. Later, API reported that inventories added 3.95 million barrels last week, topping the expected 2.75 million barrel build expected from EIA figures due today.
If the official data set prints closer to the API projection, further selling may be in store. The down move might be amplified if an unexpected US inflation pickup weighs on overall risk appetite, pushing the sentiment-sensitive WTI benchmark lower alongside stock prices.
See our free guide to learn what are the long-term forces driving crude oil prices !
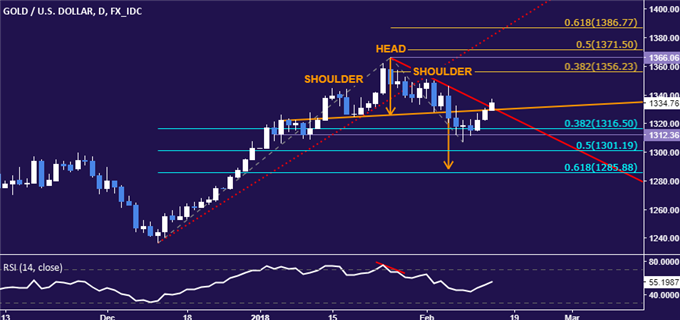
GOLD TECHNICAL ANALYSIS
Gold prices continue to probe higher, testing the intersection of a Head and Shoulders pattern neckline and falling trend resistance (now at 1331.06). Breaking above that on a daily closing basis exposes the 38.2% Fibonacci expansion at 1356.23. Alternatively, a move back below the 1312.36-16.50 area (support shelf, 38.2% Fib retracement) opens the door for a test of the 50% threshold at 1301.19.

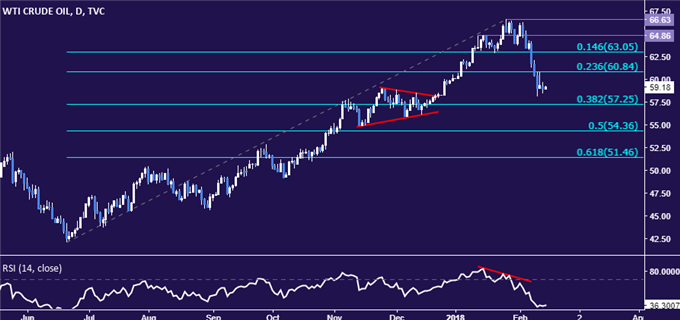
CRUDE OIL TECHNICAL ANALYSIS
Crude oil prices are making time in familiar territory, seemingly digesting losses after touching a six-week low. A daily close below the 38.2% Fibonacci retracement at 57.25 targets the 50% level at 54.36. Alternatively, a rebound back above the 23.6% Fib at 60.84 paves the way for another challenge of the 14.6% retracementat 63.05.

--- Written by Ilya Spivak, Currency Strategist for DailyFX.com
To contact Ilya, use the comments section below or @IlyaSpivak on Twitter
To receive Ilya's analysis directly via email, please SIGN UP HERE


