


Talking Points:
- Crude oil price bounce fizzles on US output bets, deeper losses likely
- Gold prices may ignore Fed’s Mester speech, focus on US CPI data
- See our guide to learn what are the long-term forces driving crude oil
Crude oil prices found some support amid a recovery in risk appetite but gains evaporated intraday. OPEC predicted that output from producers outside the cartel will grow by 1.4m b/d this year, an upgrade of about 250k b/d compared with the prior month’s estimate. Later, an EIA report said US shale output will hit 6.76m b/d in March, up from 6.65m b/d in February.
Looking ahead, a monthly report from the IEA as well as API inventory flow data are due to cross the wires. The former may offer yet more evidence that swelling US output might overwhelm OPEC-led production cut efforts. The latter will be judged against forecasts calling for a 2.6 million barrel build to be reported in official DOE statistics on the following day.
Goldprices rose as the US Dollar corrected lower, boosting the appeal of anti-fiat alternatives. From here, a speech from Cleveland Fed President Loretta Mester headlines an otherwise dull calendar. Ms Mester’s hawkish lean is well established, so comments to that effect probably won’t inspire a strong reaction from the markets. That might make for consolidation until US CPI hits the wires on Wednesday.
Find out here what retail traders’ gold buy and sell decisions hint about the price trend!
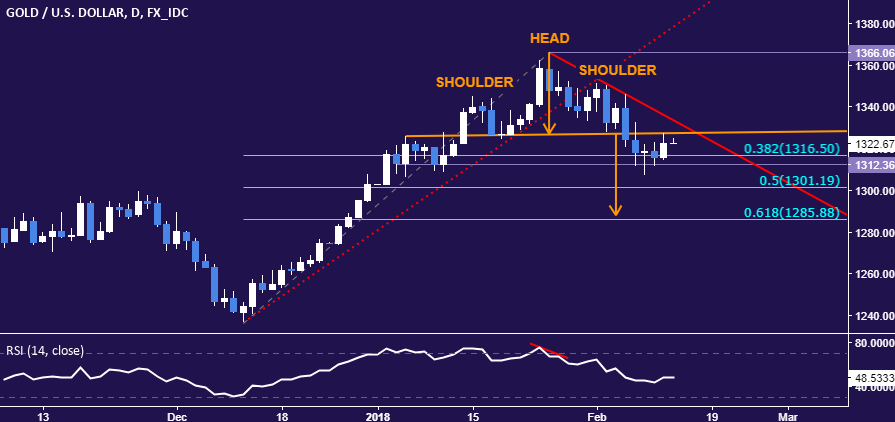
GOLD TECHNICAL ANALYSIS
Gold prices edged up to retest the former support at the neckline of a Head and Shoulders (H&S) topping pattern, leaving the overall setup and its bearish implications intact for now. A daily close above this threshold, currently at 1327.48, exposes a falling trend line at 1333.34. Alternatively, a turn below the 1312.36-16.50 area (support shelf, 38.2% Fibonacci retracement) targets the 50% level at 1301.19.
CRUDE OIL TECHNICAL ANALYSIS
Crude oil prices attempted a recovery but the move higher failed to sustain momentum. From here, a daily close below initial support marked by the 38.2% Fibonacci retracement at 57.25 exposes the 50% level at 57.25. Alternatively, a move back above the 23.6% Fib at 60.84 opens the door for a retest of the 14.6% Fibat 63.05.

--- Written by Ilya Spivak, Currency Strategist for DailyFX.com
To contact Ilya, use the comments section below or @IlyaSpivak on Twitter
To receive Ilya's analysis directly via email, please SIGN UP HERE


