


Talking Points:
- Gold price bounce may fizzle on Trump infrastructure spending plan
- Crude oil prices eye OPEC and EIA reports, risk sentiment trajectory
- See here what retail traders’ gold bets say about coming price moves
Gold prices made little headway Friday, seemingly digesting losses suffered earlier in the week. A weaker US Dollar at the start of the trading week is giving the metal a bit of a boost but that may not last as all eyes turn to an infrastructure spending plan to be unveiled by President Donald Trump.
If the markets are amply convinced that the scheme will deliver a potent boost US economic growth and push inflation upward, that is likely to inspire bets on a steeper Fed rate hike cycle. This will probably revive the greenback’s recovery, tarnishing the appeal of anti-fiat assets epitomized by gold.
Crude oil prices started the day heading lower alongside stocks on Friday. Whereas shares recovered by day’s end however, the WTI benchmark held on to most of the day’s losses after Baker Hughes data showed the number of active extraction rigs in the US jumped by the most in over a year last week.
From here, a monthly update on market trends from OPEC as well as the EIA Drilling Productivity Report are in focus. The latter may be most market-moving if it suggests that booming US output is likely to overwhelm cartel-led production cut efforts.
President Trump’s infrastructure plan may force its way to the forefront if its announcement marks a major turn in risk appetite. UK and US stock index are pointing higher before markets come online in London and New York – boosting oil prices – but fears of aggressive stimulus withdrawal might change that.
See our free guide to learn what are the long-term forces driving crude oil prices !
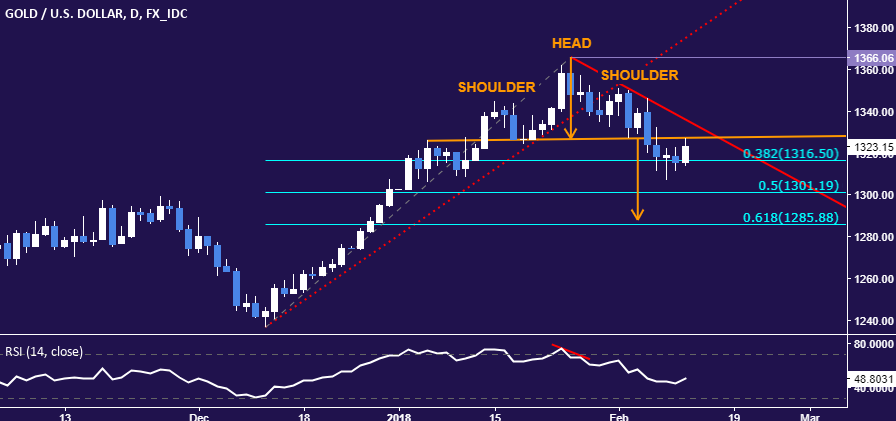
GOLD TECHNICAL ANALYSIS
Gold prices is attempting to correct higher but a Head and Shoulders (H&S) topping pattern hints the trend bias still favors the downside. A move back below the 38.2% Fibonacci retracement at 1316.50 targets the 50% level at 1301.19. Alternatively, a daily close back above the H&S neckline at 1327.40 exposes falling trend line resistance at 1335.74.
CRUDE OIL TECHNICAL ANALYSIS
Crude oil prices continue to drop toward the 38.2% Fibonacci retracement at 57.25, with a daily close below that opening the door for a test of the 50% level at 57.25. Alternatively, a return back above the 23.6% Fib at 60.84 targets the 14.6% Fibat 63.05.

--- Written by Ilya Spivak, Currency Strategist for DailyFX.com
To contact Ilya, use the comments section below or @IlyaSpivak on Twitter
To receive Ilya's analysis directly via email, please SIGN UP HERE


