Talking Points:
- Crude oil prices decline alongside equities as market sentiment sours
- Gold prices edge up as Treasury bond yields decline in risk-off trade
- See our guide to learn what are the long-term forces driving crude oil
Crude oil prices fell as risk appetite deteriorated anew on Wall Street. The WTI benchmark followed the S&P 500 lower in a move that the newswires linked to continued worries about aggressive monetary tightening. The sharp jump in wage inflation reported in January’s US employment statistics has stoked fears of a steeper rate hike cycle than previously expected. Gold prices rebounded from intraday lows as the risk-off mood translated into a drop in bond yields, boosting the appeal of non-interest-bearing alternatives.
Looking ahead, a dull offering on the economic calendar seem unlikely to make an impression on investors. Baker Hughes rig count data as well as ICE and CFTC speculative positioning statistics are on tap, but these are rarely market-moving. The prospect of another US government shutdown may dominate the spotlight instead. A conservative contingent within the Republican party is delaying passage of a bipartisan budget deal, saying it adds too much to the deficit. The absence of a speedy accord may compound risk aversion.
Find out here what retail traders’ gold trade decisions hint about the price trend!
GOLD TECHNICAL ANALYSIS
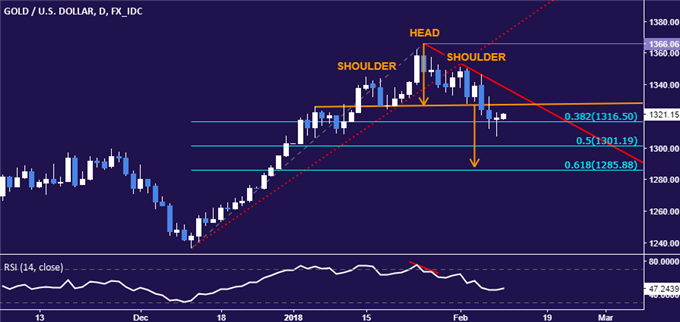
Gold prices paused to consolidate losses but a Head and Shoulders (H&S) topping setup implies a deeper decline remains ahead. A daily close below the 38.2% Fibonacci retracement at 1316.50 exposes the 50% level at 1301.19. Alternatively, a move back above the H&S neckline at 1327.42 targets falling trend line resistance at 1338.24. The overall H&S setup implies a downside target below the 1300/oz figure.

CRUDE OIL TECHNICAL ANALYSIS
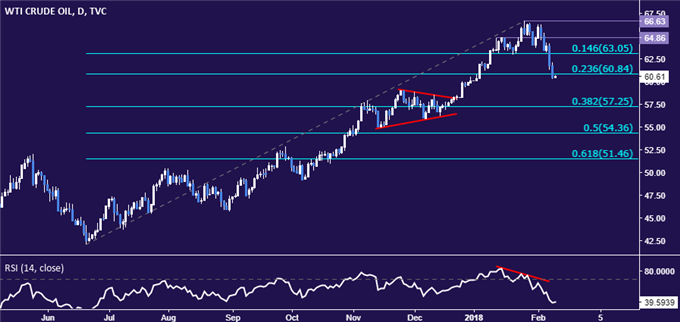
Crude oil prices continue to push lower, with a break below the 23.6% Fibonacci retracement at 60.84 paving the way for a challenge of the 38.2% level at 57.25. Alternatively, a reversal back above 60.84 – now recast as resistance – exposes the 14.6% Fibat 63.05 anew.

--- Written by Ilya Spivak, Currency Strategist for DailyFX.com
To contact Ilya, use the comments section below or @IlyaSpivak on Twitter
To receive Ilya's analysis directly via email, please SIGN UP HERE


