


Talking Points:
- Gold prices down as US Dollar gains on supportive Fed commentary
- Crude oil prices weighed down by USD gains, EIA inventory figures
- See here what retail traders’ gold bets say about coming price moves
Gold prices fell as the US Dollar marched higher alongside Treasury bond yields following supportive comments from Federal Reserve officials. That undermined the appeal of non-interest-bearing and anti-fiat assets epitomized by the yellow metal.
New York Fed President Bill Dudley said the recent “bump” in stock markets has no consequence for economic outlook and his Chicago counterpart Charles Evans said the “risks seem to be moving toward more inflation. That hinted recent turmoil has not depleted the US central bank’s appetite for rate hikes.
The greenback’s advanceweighed on crude oil prices too, in so much as global prices for the commodity are denominated in terms of the benchmark currency. EIA data showing US gasoline inventories added 3.4 million barrels last week – far more than economists expected – compounded selling pressure.
Looking ahead, a lull in top-tier scheduled event risk might make for a period of consolidation. The absence of a defined focal point may increase sensitivity to headline risk and broad-based sentiment swings however, especially given recent market turmoil. Traders would be wise to proceed with caution.
See our free guide to learn what are the long-term forces driving crude oil prices !
GOLD TECHNICAL ANALYSIS – Gold prices continue to slide having completed what looks like a Head and Shoulders (H&S) top. A break below the 38.2% Fibonacci retracement at 1316.50 on a daily closing basis targets the 50% level at 1301.19. Alternatively, a move above H&S neckline at 1327.18 exposes falling trend line resistance at 1340.70. More broadly, the H&S setup implies a measured downside objective below the 1300/oz figure.
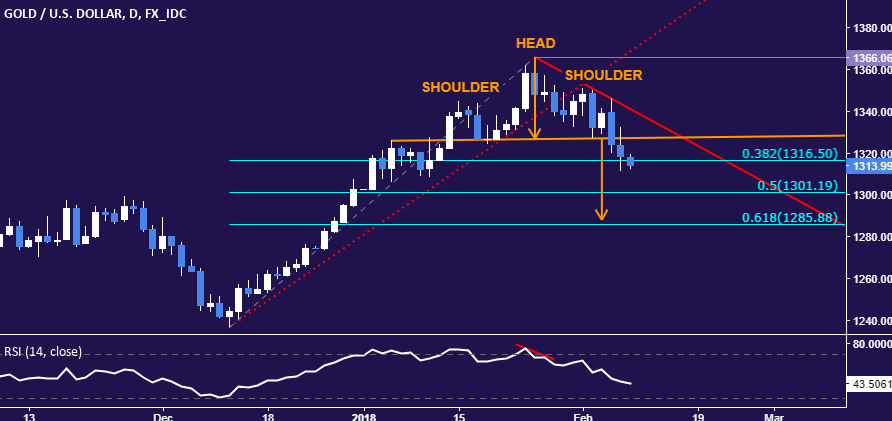
Chart created using TradingView
CRUDE OIL TECHNICAL ANALYSIS – Crude oil prices pushed downward as expected. From here, a daily close below the 23.6% Fibonacci retracement at 60.84 opens the door for a test of the 38.2% level at 57.25. Alternatively, a move back above the 14.6% Fibat 63.05 exposes the chart inflection point at 64.86 for a retest.

Chart created using TradingView
--- Written by Ilya Spivak, Currency Strategist for DailyFX.com
To receive Ilya's analysis directly via email, please SIGN UP HERE
Contact and follow Ilya on Twitter: @IlyaSpivak


