


Talking Points:
- Gold prices edge up as Treasury bond yields decline in risk-off trade
- Crude oil prices drop with stocks, vulnerable to continued weakness
- See here what retail traders’ gold bets say about coming price moves
Gold prices edged cautiously higher as brutal risk aversion spurred haven-seeking capital flows into US Treasury bonds, sending yields lower. Not surprisingly, this offered a relative lift to non-interest-bearing assets including the yellow metal. Sentiment-sensitive crude oil prices plunged alongside stocks.
From here, the API inventory flow data is due. That will be weighed against forecasts projecting a 3.2 million barrel build to be reported in official figures due Wednesday. An EIA short-term energy market outlook and Census Bureau statistics on US crude exports through December 2017 are also on tap.
Risk trends may overshadow the day’s scheduled event risk however. Futures tracking the FTSE 100 and the S&P 500 are pointing sharply lower before London and New York come online, hinting that yesterday’s trading patterns may find follow-through as investors’ mood continues to sour.
See our free guide to learn what are the long-term forces driving crude oil prices !
GOLD TECHNICAL ANALYSIS – Gold prices found interim support the bearish implications of last week's breakdown remain intact. A daily close below the February 2 low at 1327.59 exposes the 38.2% Fibonacci retracement at 1316.50. Near-term resistance is at 1351.10, February 1 high, with a move above that opening the door for a retest of the January 25 top at 1366.06.
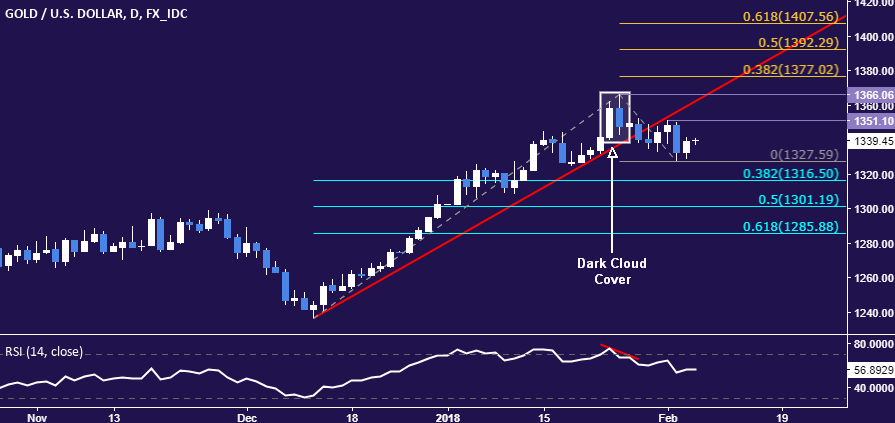
Chart created using TradingView
CRUDE OIL TECHNICAL ANALYSIS – Crude oil prices accelerated downward, pushing below support marked by the January 31 lowat 63.64 to expose the 38.2% Fib retracement at 62.62. A daily close below that targets the 50% level at 61.38. Alternatively, a move back above 63.64 eyes a chart inflection point at 64.86, followed by the January 25 high at 66.63.
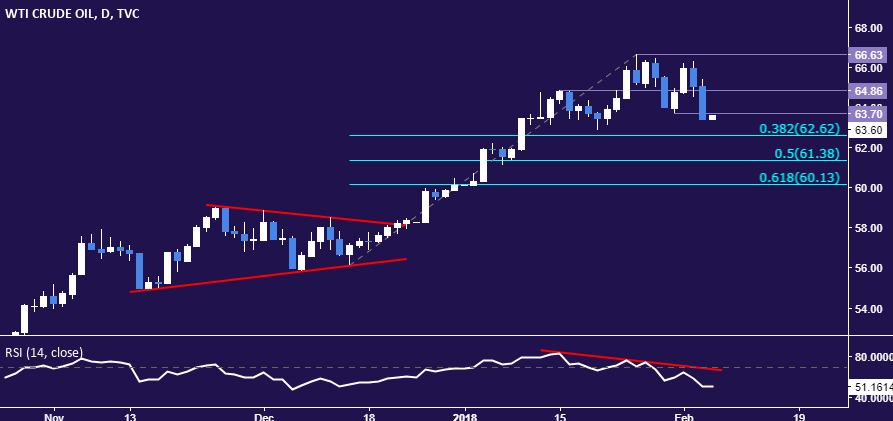
Chart created using TradingView
--- Written by Ilya Spivak, Currency Strategist for DailyFX.com
To receive Ilya's analysis directly via email, please SIGN UP HERE
Contact and follow Ilya on Twitter: @IlyaSpivak


