


Talking Points:
- Crude oil prices soar as API reports massive 11.2mb drop in US inventories
- Gold prices pull back to range floor but a convincing breakout still elusive
- What are the forces driving long-term crude oil price trends? Find out here
Crude oil prices surged as API reported a massive drawdown of inventories, saying stockpiles shed 11.2 million barrels last week. Official EIA statistics due later today are expected to show a far more modest 3.4 million barrel outflow. If the realized result hews closer to the API projection, prices may find scope to continue building upward.
Gold prices edged lower, weighed down by a parallel surge in Treasury bond yields and the US Dollar that undermined demand for non-interest-bearing and anti-fiat assets. The way forward is a bit clouded however. A singular catalyst for yesterday’s move was not readily apparent, making it difficult to identify scope for follow-through. A clearer picture may emerge after Friday’s release of US retail sales and CPI data.
What do retail traders’ bets suggest about gold price trends? Find out here !
GOLD TECHNICAL ANALYSIS – Gold prices pulled back but remained locked within a now-familiar range above the $1300/oz figure. Negative RSI divergence continues to warn of a larger topping in the works. A daily close below the 61.8% Fibonacci retracement as 1311.34 exposes the 50% level at 1297.08. Alternatively, a push above the 76.4% Fib at 1328.98 opens the door for a challenge of the September 8 high at 1357.50.
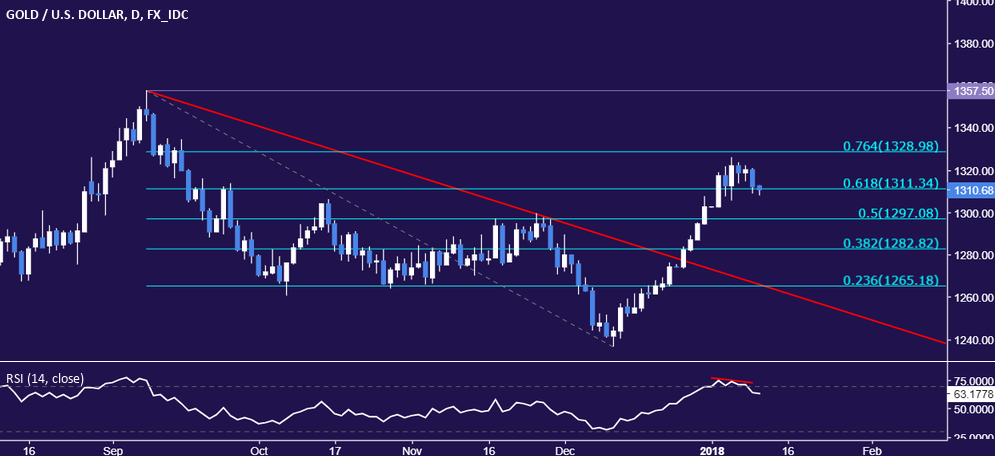
Chart created using TradingView
CRUDE OIL TECHNICAL ANALYSIS – Crude oil prices punched above resistance at 62.31, the 38.2%Fibonacci expansion, to expose the 50% level at 64.32. A further push beyond that targets the 61.8% Fib at 66.33. Alternatively, a move back below 62.31 – now recast as support – paves the way for a retest of the 23.6% expansion at 59.83 as support.
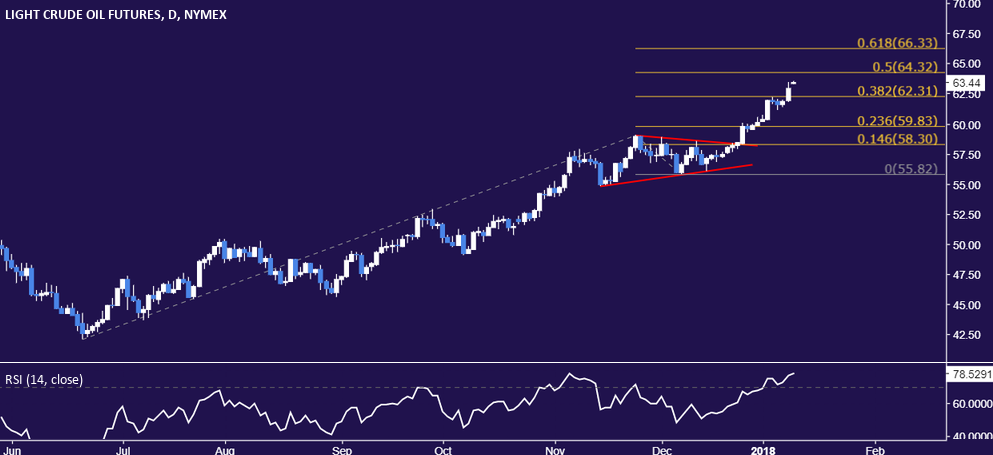
Chart created using TradingView
--- Written by Ilya Spivak, Currency Strategist for DailyFX.com
To receive Ilya's analysis directly via email, please SIGN UP HERE
Contact and follow Ilya on Twitter: @IlyaSpivak


