


Talking Points:
- Gold prices may turn lower if FOMC minutes offer a boost to the US Dollar
- Crude oil prices eyeing API inventories data as slow upward drift continues
- What do retail traders’ bets suggest about gold price trends? Find out here
Gold prices surged as the US Dollar weakened despite seemingly supportive upshift in front-end Treasury bond yields and a steepening priced-in outlook for the 2018 Fed rate hike path. The currency’s troubles might have reflected capital flows out of cash and into riskier assets as traders reallocated portfolios after the holiday lull. The metal may suffer if the greenback finds a lifeline in minutes from December’s FOMC meeting.
Crude oil prices drifted higher, cautiously building on previous gains triggered just before the calendar turned to 2018. The weekly set of API inventory flow statistics is now in focus. The release will be weighed up against official EIA figures expected to show raw material storage shed 4.5 million barrels last week while 1.93 million barrels were added to gasoline stocks.
What are the forces driving long-term crude oil price trends? Find out here !
GOLD TECHNICAL ANALYSIS – Gold prices are aiming at resistance marked by the 61.8% Fibonacci expansion at 1330.89 after clearing the 50% level at 1312.90. A daily close above the former level exposes the 1353.15-57.50 area (76.4% Fib, September 8 high). Alternatively, a reversal back below 1312.90 opens the door for a retest of the 38.2% expansion at 1294.91.

Chart created using TradingView
CRUDE OIL TECHNICAL ANALYSIS – Crude oil prices continue to edge higher after completing a bullish Triangle chart pattern, as expected. Breaking above the 38.2% Fibonacci expansion at 62.31 on a daily closing basis targets the 50% level 64.32. Alternatively, a return back below the 23.6% Fib at 59.83 sees the next downside barrier at 58.30, the 14.6% expansion.
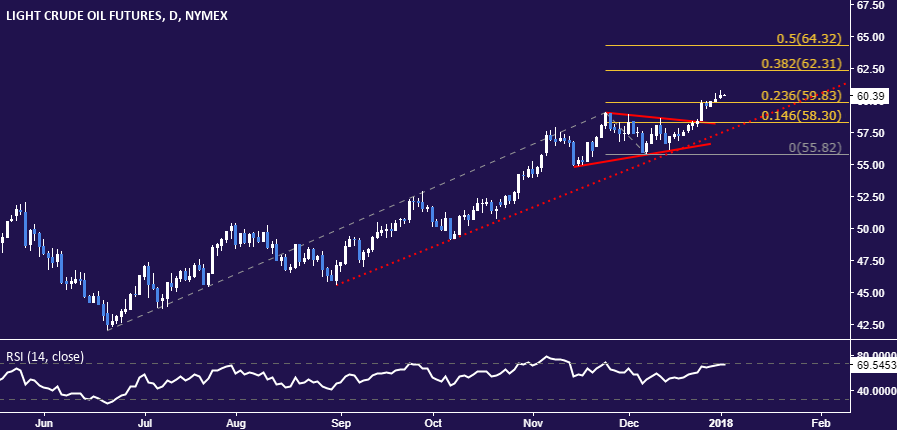
Chart created using TradingView
--- Written by Ilya Spivak, Currency Strategist for DailyFX.com
To receive Ilya's analysis directly via email, please SIGN UP HERE
Contact and follow Ilya on Twitter: @IlyaSpivak


