


Talking Points:
- Crude oil prices rise to levels unseen since mid-2015 as the US Dollar sinks
- Gold prices find familiar support as Treasury bond yields fall alongside USD
- What are the forces driving long-term crude oil price trends? Find out here
A plunging US Dollar translated into gains for commodities. The currency fell alongside Treasury bond yields, boosting the appeal of non-interest-bearing and anti-fiat alternatives. Not surprisingly, that sent gold prices marching higher. Crude oil prices got a lift as well as a weaker greenback translated into a de-facto boost for USD-denominated assets.
A clear-cut catalyst for the move is not readily apparent, which would be unusual for a broad-based swing across the key financial market benchmarks in normal conditions. It seems far less surprising considering the thin liquidity conditions prevailing in the short stretch of active trade between the Christmas and New Year holidays observed by most of the world’s top trading venues.
On balance, the move seems to be an extension of “fade the Fed” dynamics emerging after December’s FOMC meeting, with a much-diminished number of buyers and sellers at every price level magnifying swings that might have otherwise appeared more restrained. Traders would be wise to keep this in mind in the days ahead and early next week as participation slowly rebuilds before assuming such moves imply conviction.
What do retail traders’ bets suggest about gold price trends? Find out here !
GOLD TECHNICAL ANALYSIS – Gold prices breached the bounds of a down trend established from September’s swing top. A daily close above the 38.2% Fibonacci retracement at 1282.61 opens the door for a test of the 50% level at 1296.91. Alternatively, a move back below the trend line (now at 1276.36) paves the way for a retest of the 23.6% Fib at 1264.82.
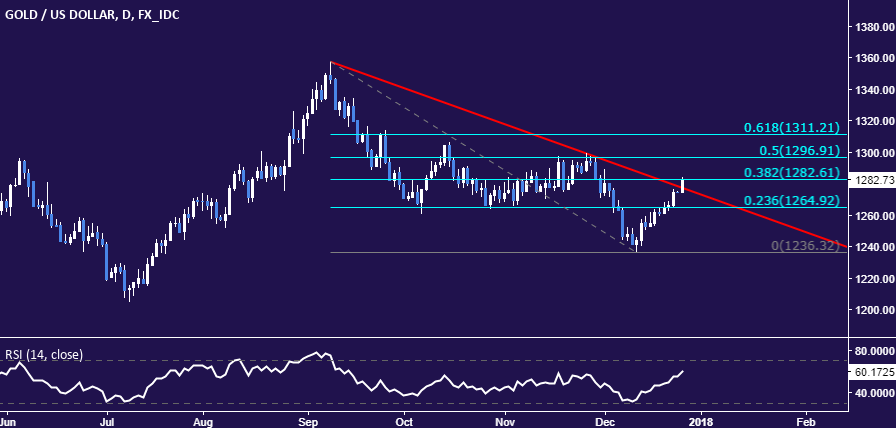
Chart created using TradingView
CRUDE OIL TECHNICAL ANALYSIS – Crude oil prices broke upward from a Triangle chart pattern, as expected. From here, a daily close above the 23.6% Fibonacci expansion at 59.83 exposes the 38.2% level at 62.31. Alternatively, a reversal back below the 14.6% Fib at 58.30 sets the stage for a retest of rising trend line support, now at 57.02.
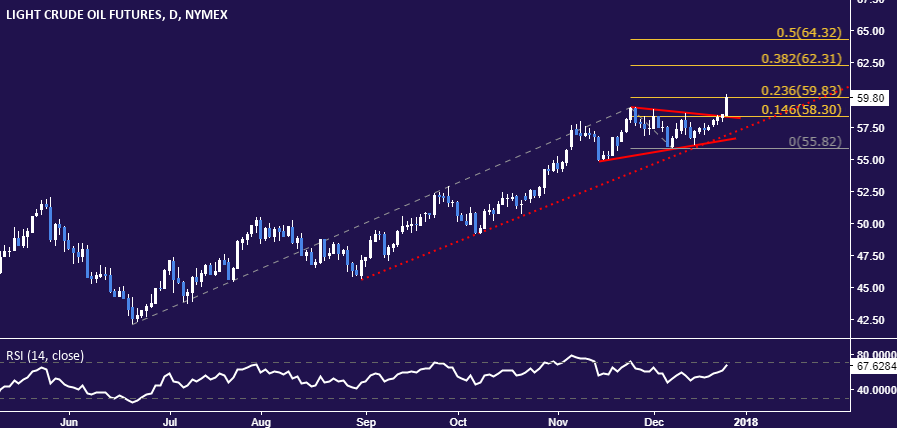
Chart created using TradingView
--- Written by Ilya Spivak, Currency Strategist for DailyFX.com
To receive Ilya's analysis directly via email, please SIGN UP HERE
Contact and follow Ilya on Twitter: @IlyaSpivak


