Talking Points:
- Gold prices edge up on US GDP downgrade, PCE inflation data next on tap
- Crude oil prices rise as Russia, Saudi Arabia pledge continued cooperation
- What do retail traders’ bets suggest about gold price trends? Find out here
Gold prices were little-changed on Thursday, with a small bounce after an unexpected downgrade of third-quarter US GDP data failing breach familiar ranges (as expected). The Fed’s favored PCE inflation gauge is next up ahead, with the core price-growth rate expected to hit a five-month high at 1.5 percent. As with the GDP revision however, the markets’ reaction may be muted in thin pre-holiday trade.
As withthe yellow metal, crude oil prices enjoyed a bit of a lift but struggled to sustain momentum. The boost came after Russian President Vladimir Putin and Saudi King Salman Bin Abdulaziz – leaders of the world’s top two producers – pledged continued pledged to continue cooperating to maintain energy market stability. From here, a lull in top-tier news flow seems likely to make for a quiet end to the trading week.
What are the forces driving long-term crude oil price trends? Find out here !
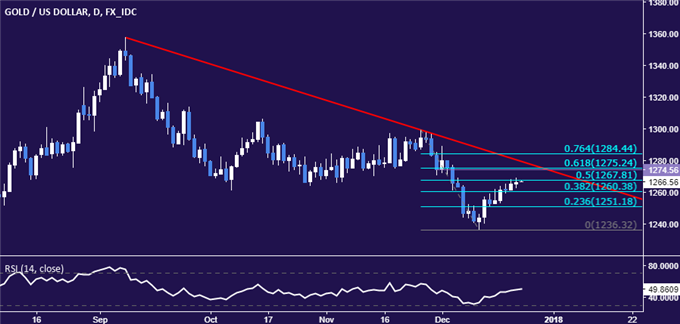
GOLD TECHNICAL ANALYSIS – Gold prices continue to test, the 50% Fibonacci retracement at 1267.81. Breaking this barrier on a daily closing basis opens the door for a test of the 1274.56-75.24 area (November 30 close, 61.8% level). Alternatively, a move back below the 38.2% Fib at 1260.38 exposes the 23.6% retracement at 1251.18 anew.

Chart created using TradingView
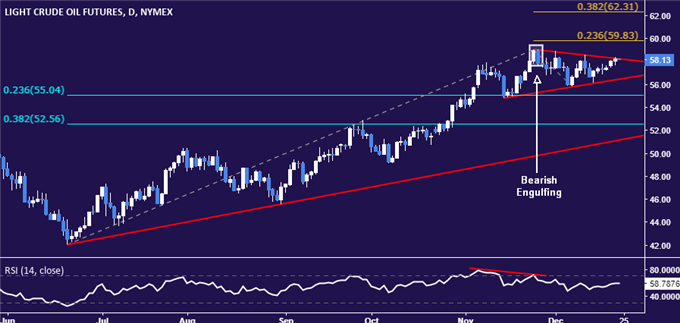
CRUDE OIL TECHNICAL ANALYSIS – Crude oil prices are still oscillating within a would-be Triangle chart pattern, a setup arguing for upside continuation (in this case, given the preceding trend). A daily close above the Triangle top (58.25) exposes the 23.6% Fibonacci expansion at 59.83. Alternatively, a move below its bottom (56.48) sees the next downside barrier at 55.04, the 23.6% Fib retracement.

Chart created using TradingView
--- Written by Ilya Spivak, Currency Strategist for DailyFX.com
To receive Ilya's analysis directly via email, please SIGN UP HERE
Contact and follow Ilya on Twitter: @IlyaSpivak


