


Talking Points:
- Gold drops to near 5-month low on hopes for fiscal inflation boost
- US wage growth pickup may drive bets on steeper Fed rate hike path
- Crude oil prices edge higher after plunge amid lull in key news flow
Gold prices sank as the so-called “Trump trade” narrative got a boost from reports that the US president will unveil a long-anticipated infrastructure spending plan in early January. Markets seemed to read that as compounding the inflationary boost from tax cut legislation now working its way through Congress. The prospect of faster price growth stoked Fed rate hike bets, understandably hurting the yellow metal.
The spotlight now turns to November’s US labor-market data. A slight slowdown in the pace of job creation and a steady unemployment rate are expected, none which ought to be particularly exciting considering a rate hike is all but priced in for next week’s FOMC meeting. An expected rebound in wage inflation might lift 2018 tightening prospects however, hurting gold further.
Crude oil prices edged as a lull in relevant news flow made room for a correction following the prior session’s dramatic plunge. Baker Hughes rig count data as well as ICE and CFTC speculative positioning statistics are next on tap, but these are rarely market-moving. That may relegate prices to continued consolidation through the week-end unless some unforeseen catalyst emerges.
What are the forces driving long-term crude oil price trends? Find out here !
GOLD TECHNICAL ANALYSIS – Gold prices accelerated downward, hitting the lowest level in over four months. Near-term support is now at 1246.28, the 61.8% Fibonacci expansion, with a daily close below that targeting the 76.4% level at 1232.16. Alternatively, a move back above support-turned-resistance at 1260.80, the October 6 low, may lead to a retest of the 38.2% Fib at 1269.10.

Chart created using TradingView
CRUDE OIL TECHNICAL ANALYSIS – Crude oil prices corrected higher but Wednesday’s breakdown remained intact on a retest of former support. From here, a daily close below the 38.2% Fibonacci retracement at 55.25 exposes the 50% level at 54.08. Alternatively, a break back above the 23.6% Fib at 56.70 paves the way to challenge the underside of a rising trend line set from early October, now at 58.23.
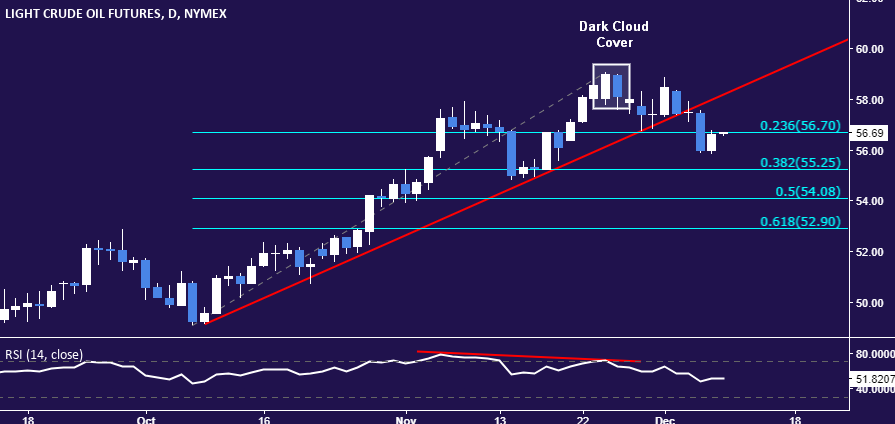
Chart created using TradingView
--- Written by Ilya Spivak, Currency Strategist for DailyFX.com
To receive Ilya's analysis directly via email, please SIGN UP HERE
Contact and follow Ilya on Twitter: @IlyaSpivak


