


Talking Points:
- Gold prices edge up as risk aversion weighs on Treasury bond yields
- Crude oil prices echo sentiment trends, decline alongside S&P 500
- Stock futures see risk-on day ahead, services ISM and API data due
Gold prices edged a bit higher as risk appetite suffered yesterday. Capital poured out of riskier assets and into the haven of government bonds, pushing yields lower. That made non-interest-bearing alternatives epitomized by the yellow metal appear a bit more appealing. Meanwhile, the risk-off mood weighed on sentiment-sensitive crude oil prices, with the WTI benchmark tracking the S&P 500 downward.
US stock index futures are pointing higher ahead of the opening bell on Wall Street, hinting that that a reversal of yesterday’s trade patterns may be ahead. However, it ought to be kept in mind that a risk-on day was expected on similar grounds yesterday, and clearly didn’t materialize accordingly. It seems wise to tread carefully while a lull in clearly defined event risk leaves matters up to fickle sentiment trends.
The service-sector US ISM survey is on tap – with a bit of a downtick expected – but the outcome may pass with little incident considering the firmly entrenched outlook for next week’s FOMC meeting. The API weekly inventory flow report is also due. It will be judged against forecasts calling for a 2.95 million barrel drawdown to be unveiled in official EIA statistics scheduled for Wednesday.
What do retail traders’ gold buy/sell decisions hint about on-coming price moves? Find out here !
GOLD TECHNICAL ANALYSIS – Gold prices are marking time near familiar support in the 1266.44-69.10 area (October 6 low, 38.2% Fibonacci expansion). A daily close below that targets the 50% level at 1257.69. Alternatively, a turn back above channel floor support-turned-resistance at 1281.73 exposes the 38.2% Fib retracement at 1297.74 anew.
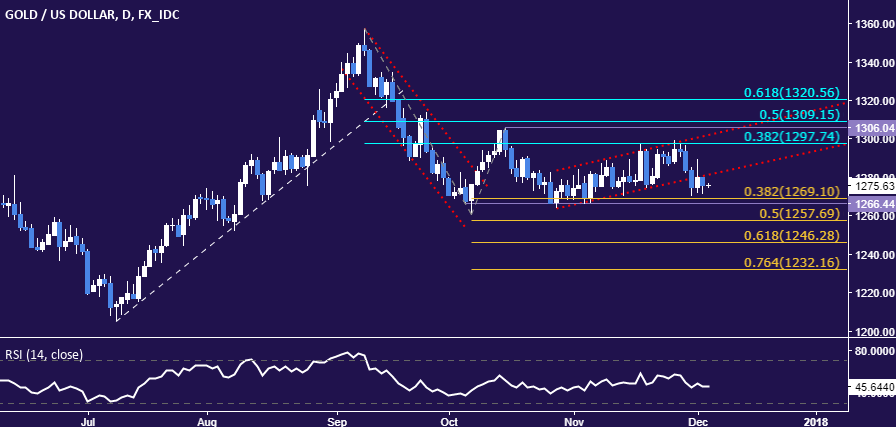
Chart created using TradingView
CRUDE OIL TECHNICAL ANALYSIS – Crude oil prices are testing below trend line support guiding prices higher since early October. A daily close below that and the 23.6% Fibonacci retracement at 56.70 exposes the 38.2% level at 55.25. Alternatively, a push above the 23.6% Fib expansion at 59.10 sees the next upside threshold at 60.55.

Chart created using TradingView
--- Written by Ilya Spivak, Currency Strategist for DailyFX.com
To receive Ilya's analysis directly via email, please SIGN UP HERE
Contact and follow Ilya on Twitter: @IlyaSpivak


