


Talking Points:
- Gold price outlook hinges on Senate tax cut vote result
- Crude oil prices struggle despite output cuts extension
- Just getting started trading? See our beginners’ guide
Gold prices declined as a swell in risk appetite pushed Treasury bonds lower and sent yields higher alongside share prices. Not surprisingly, that undermined the appeal of non-interest-bearing assets epitomized by the yellow metal. From here, all eyes are on the US Senate, where lawmakers are due to vote on a tax cut plan. If it passes and isn’t watered down by delays and counter-cyclical provisions, gold is likely to fall further.
Crude oil prices were unable to build higher after OPEC and like-minded producers extended the cartel-led production cut scheme due to expire in March through the end of 2018. The move was widely expected and failed to excite investors. Enthusiasm was further dampened by the absence of agreement on a strategy for unwinding the program once it runs its course, as expected.
Retail traders expect gold prices to rise. Find out here what that hints about the coming trend!
GOLD TECHNICAL ANALYSIS – Gold prices turned lower but fell short of breaking range support. A daily close below the 1266.44-69.10 area (October 6 low, 38.2% Fibonacci expansion) exposes the 50% level at 1257.69. Alternatively, a move back above channel floor support-turned-resistance at 1280.26 opens the door for another test of the 38.2% Fib retracement at 1297.74.
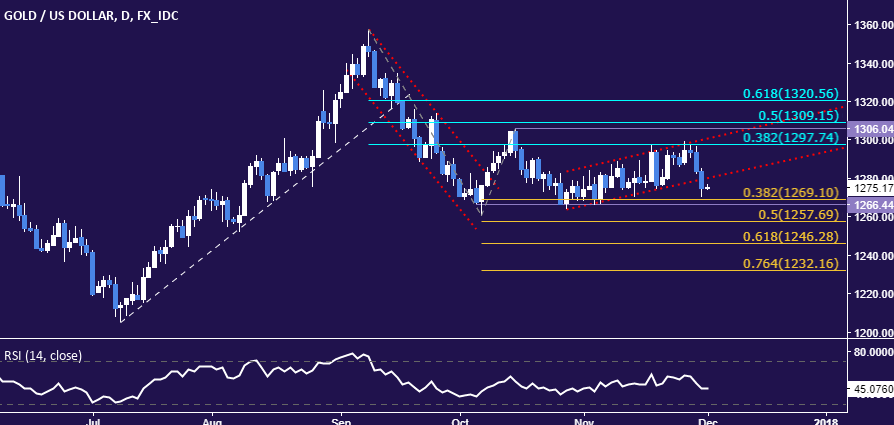
Chart created using TradingView
CRUDE OIL TECHNICAL ANALYSIS – Crude oil prices continue to hover above support at 56.70, the 23.6% Fibonacci retracement. A daily close below that targets the 38.2% level at 55.25. Alternatively, a move back above support-turned-resistance at 57.92 exposes the 23.6% Fib expansion at 59.10.
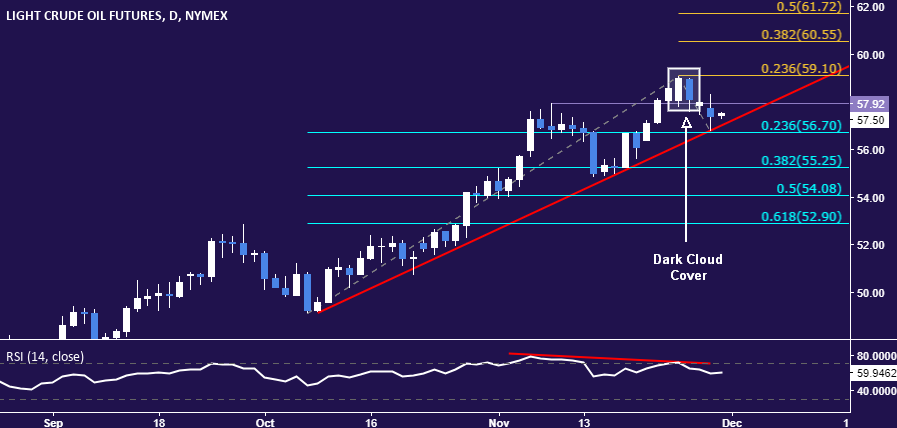
Chart created using TradingView
--- Written by Ilya Spivak, Currency Strategist for DailyFX.com
To receive Ilya's analysis directly via email, please SIGN UP HERE
Contact and follow Ilya on Twitter: @IlyaSpivak


