


Talking Points:
- Gold prices may turn lower on Fed’s Yellen speech, US Q3 GDP revision
- Crude oil prices may shrug off EIA inventory data as OPEC meeting looms
- What do retail traders’ buy/sell bets say about gold trends? Find out here
Gold prices are looking to a speech from Fed Chair Janet Yellen for direction after comments from her presumptive successor Jerome Powell failed to move the needle yesterday. If the outgoing FOMC chief endorses September’s forecast calling for three rate hikes in 2018, the yellow metal may decline. An expected upgrade of third-quarter US GDP growth might amplify selling pressure.
Meanwhile, crude oil prices are eyeing EIA inventory data. Analysts expect a 2.49 million barrel draw but API estimates published yesterday surprised with a 1.82 million barrel build. Prices may fall if official figures echo that result, though follow-through may be absent ahead of the upcoming OPEC meeting, where the cartel and its partners are seen extending their production cut scheme for 9 months beyond March 2018.
Have a question about trading commodities? Join a Q&A webinar and ask it live!
GOLD TECHNICAL ANALYSIS – Gold prices remain locked in familiar territory below the 38.2% Fibonacci retracement at 1297.74. A break above this barrier confirmed on a daily closing basis exposes the 1306.04-9.15 area (October 16 high, 50% level). Alternatively, a move below the 38.2% Fib expansionat 1269.10 targets the 1257.69-60.80 region (October 6 low, 50% expansion).
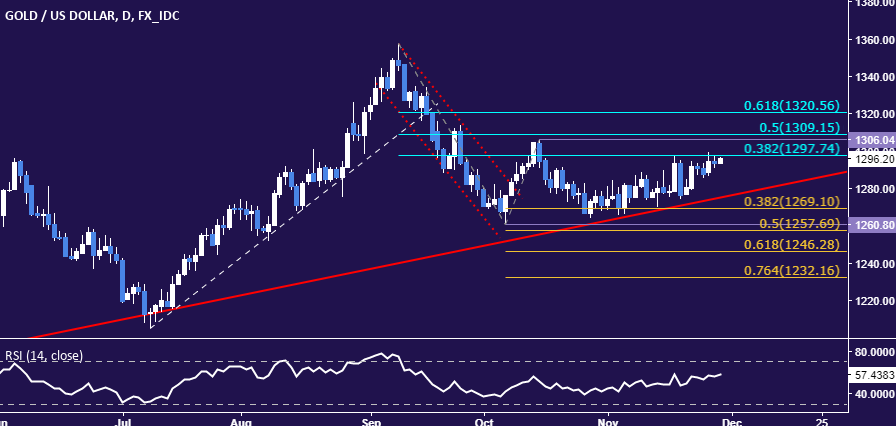
Chart created using TradingView
CRUDE OIL TECHNICAL ANALYSIS – Crude oil prices may turn lower after putting in a bearish Dark Cloud Cover candlestick pattern bolstered by negative RSI divergence. From here, a daily close below the 23.6% Fibonacci expansion at 57.72 targets the 56.61-82 area (resistance-turned-support, 14.6% level). Alternatively, a push through the 38.2% Fib at 59.52 exposes the 50% expansion at 60.98.
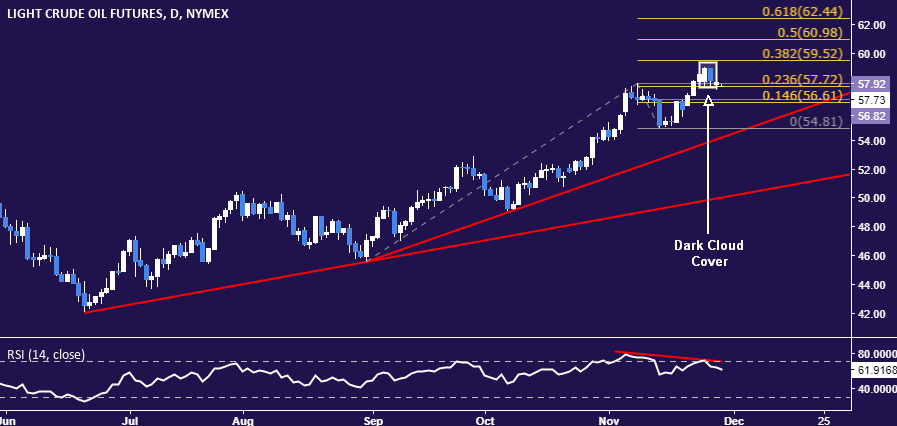
Chart created using TradingView
--- Written by Ilya Spivak, Currency Strategist for DailyFX.com
To receive Ilya's analysis directly via email, please SIGN UP HERE
Contact and follow Ilya on Twitter: @IlyaSpivak


