


Talking Points:
- Crude oil prices snap four-day win streak as OPEC meeting draws closer
- Gold prices edge up but fail to break from familiar congestion range again
- API inventory flow data, Powell Senate confirmation hearing now in focus
Crude oil prices turned lower, snapping a four-day winning streak. The move precedes an OPEC meeting in Vienna this week. That is expected to produce an extension of the cartel-led output cut scheme expiring in March and outline an exit strategy for eventually unwinding it. Still, with prices near a two-year high before key event risk, some protective profit-taking was perhaps to be expected.
API inventory flow data is now in focus. The private-sector estimate will be assessed relative to median forecasts calling for a 2.54 million barrel draw to be reported in official EIA statistics due Wednesday. Oil prices are likely to rise if API’s figures argue for a larger outflow. Needless to say, a smaller one will probably have the opposite effect.
Gold prices edged cautiously higher, buoyed by a pullback in Treasury bond yields and a slight flattening of priced-in 2018 Fed rate hike path projections, but failed to break from a familiar congestion range. Comments from the likely future Fed Chair Jerome Powell at his Senate confirmation hearing are now in focus. The yellow metal may fall if he seems to endorse September’s FOMC forecast for three rate hikes next year.
What are the forces driving long-term crude oil price trends? See our guide to find out!
GOLD TECHNICAL ANALYSIS – Gold prices were unable to hold above the 38.2% Fibonacci retracement at 1297.74 yet again. A daily close above this threshold targets the 1306.04-9.15 area (October 16 high, 50% level). Alternatively, a move back below the 38.2% Fib expansionat 1269.10 exposes the 1257.69-60.80 region (October 6 low, 50% expansion).
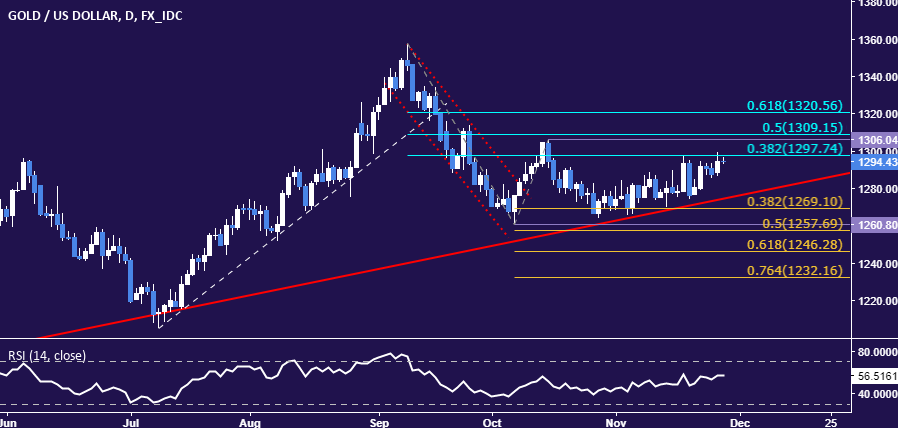
Chart created using TradingView
CRUDE OIL TECHNICAL ANALYSIS – Crude oil prices put in a bearish Dark Cloud Cover candlestick pattern, hinting a move lower may be ahead. Negative RSI divergence bolsters the case for a downside scenario. A daily close below the 23.6% Fibonacci expansion at 57.72 exposes the 56.61-82 area (resistance-turned-support, 14.6% level). Alternatively, a push above the 38.2% Fib at 59.52 targets the 50% expansion at 60.98.
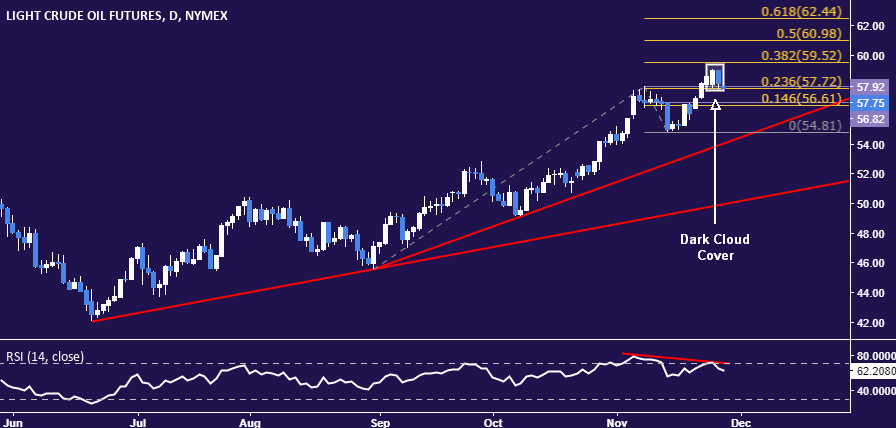
Chart created using TradingView
--- Written by Ilya Spivak, Currency Strategist for DailyFX.com
To receive Ilya's analysis directly via email, please SIGN UP HERE
Contact and follow Ilya on Twitter: @IlyaSpivak


