


Talking Points:
- Gold prices still range-bound as defining event risk looms ahead
- Crude oil prices buoyed by hopes for OPEC output cut extension
- Did we get it right in our Q4 commodity forecasts? Find out here
Gold prices have struggled to make much of recent US Dollar losses. The flagship anti-fiat asset might have been expected to soar as cooling Fed rate hike bets punish the greenback but has turned in a reserved response instead. A lull in top-tier news flow over the coming 24 hours suggests this is unlikely to change for now but major on-coming event risk means that a breakout may well be in the cards this week.
Meanwhile, crude oil prices continue to push higher amid speculation that an OPEC meeting in Vienna this week will produce an extension of a cartel-led production cut scheme due to expire in March. Stage-setting commentary from key officials leading into the sit-down – particularly from critical non-OPEC producers, such as Russia – may drive price action in the interim.
Retail traders are betting that gold will rise. Find out here what this hints about the price trend!
GOLD TECHNICAL ANALYSIS – Gold prices are still confined to a choppy range below the 38.2% Fibonacci retracement at 1297.74. A daily close above this barrier initially exposes the 1306.04-9.15 area (October 16 high, 50% level). Alternatively, a turn below the 38.2% Fib expansionat 1269.10 opens the door for a test of the 1257.69-60.80 region (October 6 low, 50% expansion).
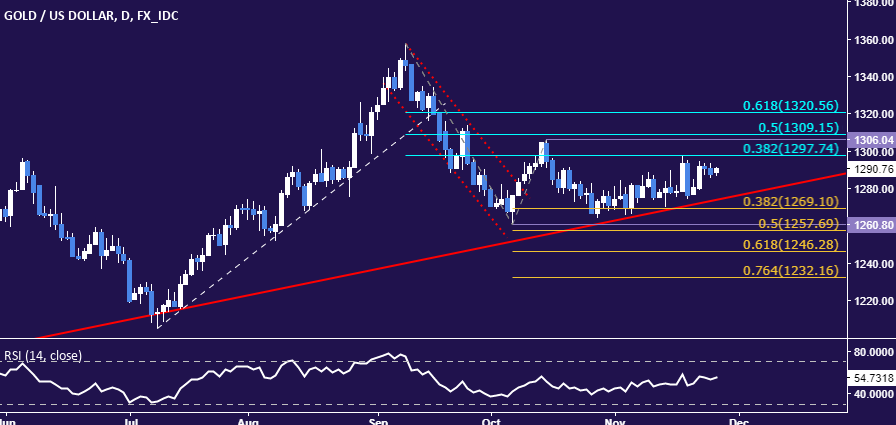
Chart created using TradingView
CRUDE OIL TECHNICAL ANALYSIS – Crude oil prices are taking aim at resistance marked by the 38.2% Fibonacci expansion at 59.52, with a break above that on a daily closing basis exposing the 50% level at 60.98. Alternatively, a reversal back below the 23.6% Fib at 57.72 targets the 56.61-82 area (resistance-turned-support, 14.6% expansion).
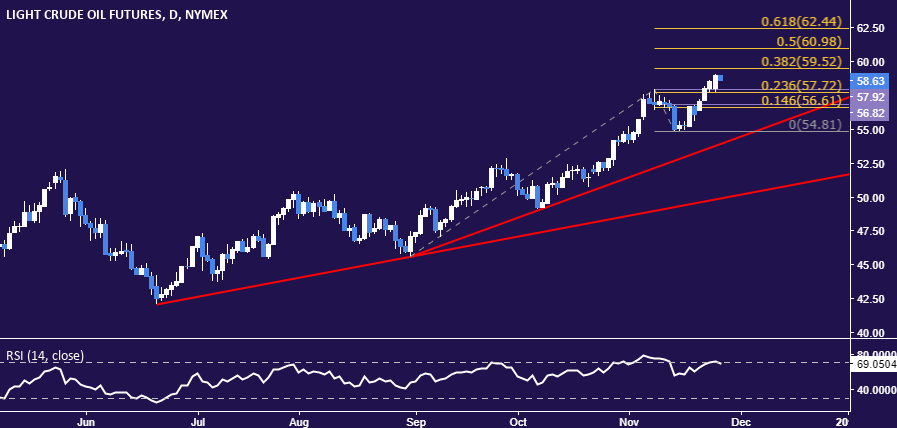
Chart created using TradingView
--- Written by Ilya Spivak, Currency Strategist for DailyFX.com
To receive Ilya's analysis directly via email, please SIGN UP HERE
Contact and follow Ilya on Twitter: @IlyaSpivak


