Talking Points:
- Crude oil prices rise amid hopes for an extension of OPEC production cuts
- Gold prices edge up as FOMC minutes signal shallow 2018 rate hike path
- How are DailyFX Q4 commodity price forecasts holding up? Find out here
Crude oil prices rose to the highest level since mid-2015 amid speculation that OPEC will extend a cartel-led production cut scheme at its upcoming meeting. Prices briefly dipped as EIA inventories data showed US stockpiles shed 1.86 million barrels last week. The result topped forecasts calling for a 1.43 million barrel outflow but fell substantially short of the hefty 6.3 million barrel draw reported in analogous API data.
Gold prices edged up after minutes from this month’s FOMC meeting hinted at a shallow tightening path in 2018. The document affirmed the likelihood of a widely anticipated rate hike in December, saying many policymakers saw a “near term” increase as warranted. However, it also showed that many on the committee saw inflation to undershooting the target for relatively longer, which may mean fewer hikes next year.
What are the forces driving long-term crude oil price trends? See our guide to find out!
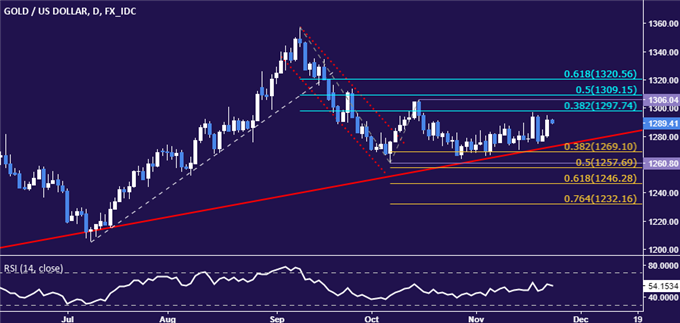
GOLD TECHNICAL ANALYSIS – Gold prices remain stuck within a familiar congestion range. A daily close above the 38.2% Fibonacci retracement at 1297.74 sees the next upside threshold in the 1306.04-9.15 area (October 16 high, 50% level). Alternatively, a drop below the 38.2% Fib expansionat 1269.10 targets the 1257.69-60.80 region (October 6 low, 50% expansion).

Chart created using TradingView
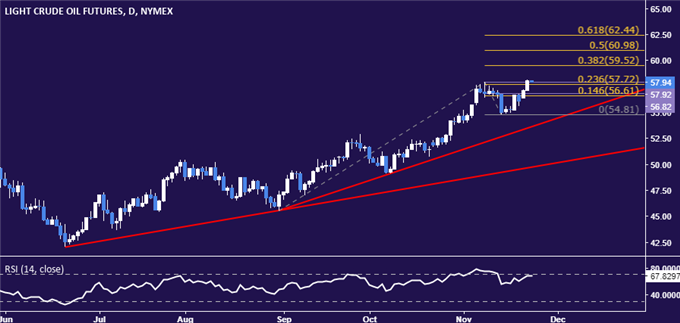
CRUDE OIL TECHNICAL ANALYSIS – Crude oil prices continued to push higher, setting a new high for the year. From here, a daily close above the 38.2% Fibonacci expansion at 59.52 opens the door for a test of the 50% level at 60.98. Alternatively, a turn back below the 23.6% Fib at 57.72 exposes the 56.61-82 area (resistance-turned-support, 14.6% expansion) once more.

Chart created using TradingView
--- Written by Ilya Spivak, Currency Strategist for DailyFX.com
To receive Ilya's analysis directly via email, please SIGN UP HERE
Contact and follow Ilya on Twitter: @IlyaSpivak


